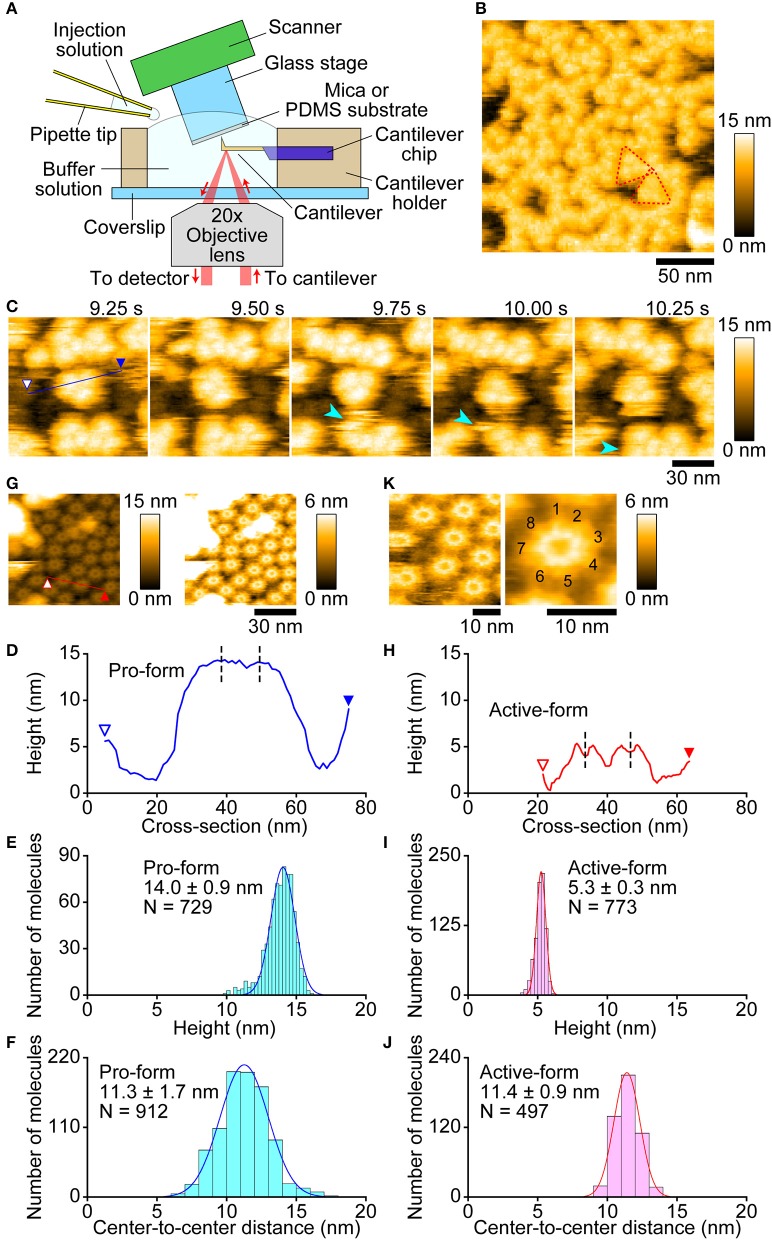
Figure 4.
Molecular features of pro- and active-Monalysin on a mica surface visualized by AFM. (A) Experimental design for AFM analysis. Samples were absorbed into a substrate surface and imaged by a probe-tip attached at the end of a cantilever. In some experiments, the injection solution was added to the buffer solution during AFM imaging. (B) A wide-area image of pro-Monalysin. Typical trefoil-shaped molecules are encircled by red dashed-lines. The scanning area was 200 × 200 nm2 with 100 × 100 pixels, and the imaging rate was 330 ms/frame. (C) Successive AFM images of pro-Monalysin (see Supplementary Movie 1). The light blue arrowhead shows that a pro-form detaches from, and binds to, a trefoil-shaped molecule. The scanning area was 100 × 100 nm2 with 100 × 100 pixels and the imaging rate was 250 ms/frame. (G) A wide-area image of active-Monalysin. Two different height scale images are shown. Bright spots are some adsorbed debris. The scanning area was 80 × 80 nm2 with 160 × 160 pixels and the imaging rate was 330 ms/frame. (K) Small-area image of active-Monalysin (see Supplementary Movie 3). The scanning area was 40 × 40 nm2 with 120 × 120 pixels, and the imaging rate was 150 ms/frame. The right image is an averaged image using four successive images. (D,H) A cross-section analysis of pro- and active-Monalysin. The sections are from the blue and red lines drawn on the images in C,G. Each dashed line indicates the center position of a molecule used in the analysis of F,J. (E,I) Height distributions of pro- and active-Monalysin. (F,J) Center-to-center distance distributions of pro- and active-Monalysin. All distributions were fitted by single-Gaussian curve.

