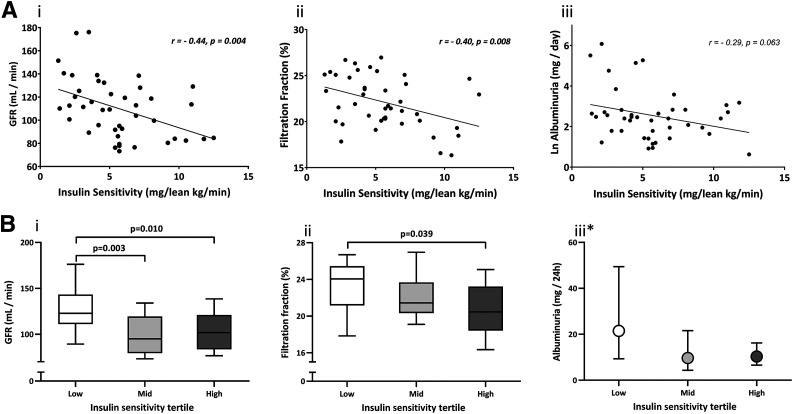
Figure 1.
A: Correlations between insulin sensitivity (lean M value) and renal measures. i: GFR. ii: FF. iii: log albuminuria. Pearson correlations are shown. B: Tertiles of insulin sensitivity (lean M value) compared with regard to renal function. i: GFR. ii: FF. iii: Albuminuria. Box and whisker plots are shown in i and ii, and geometric mean and 95% CI are shown in iii. The P values are calculated by Bonferroni post hoc test after significant one-way ANOVA. *ANOVA nonsignificant.

