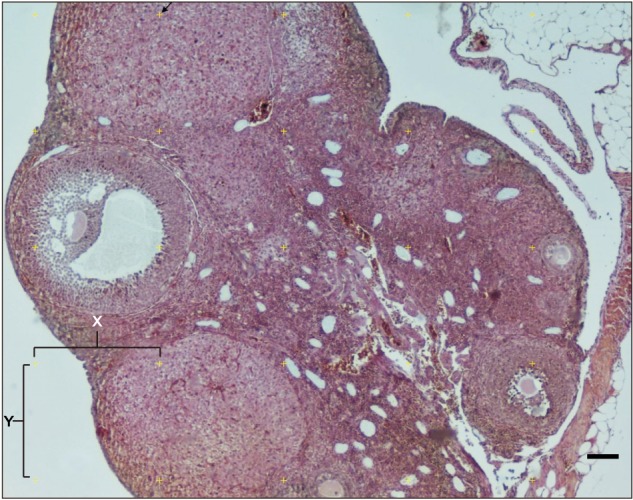
Fig. 2. Calculation of the total volume and cortex to medulla ratio of the ovary of mice using point-count method. Between two plus signs on the horizontal and vertical axis, defined as ‘X’ and ‘Y’, the tissue falling into the right-top corner of the counting Point Grid was included in the counting (arrow). Scale bar=100 µm.

