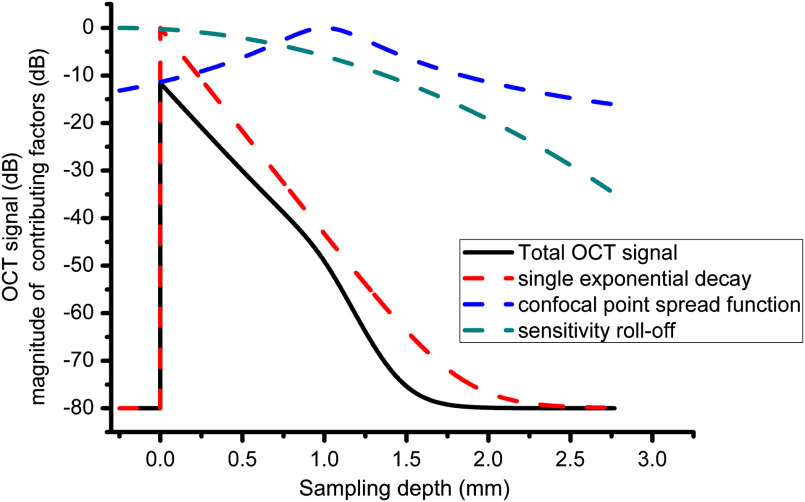
Fig. 2.
Simulated average A-scan according to Eq. (2) (black curve) and the contribution of the individual terms, including single exponential decay (red dash), CPSF (blue dash), and sensitivity roll-off (green dash). Parameters for the simulation are: ; ; refractive index ; noise floor at ; Rayleigh length ; focus location ; center wavelength and spectral sampling increment are and , respectively, giving a maximum imaging depth of ; .

