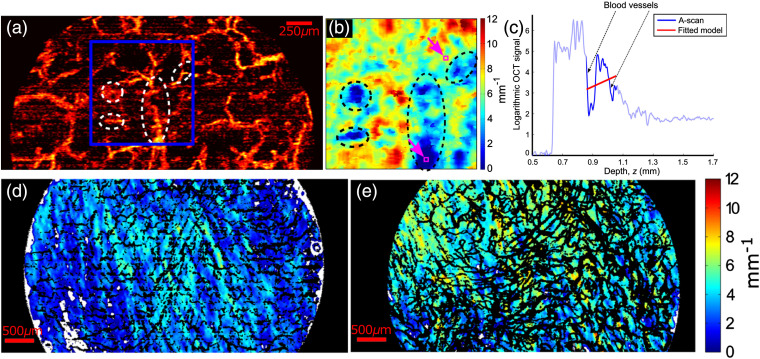
Fig. 6.
OCT attenuation imaging of human skin in vivo. (a) OCT vasculature image of normal skin. (b) Parametric attenuation coefficient imaging of the tissue region in the blue square in (a). Dashed circles outline the regions with incorrect attenuation coefficients due to the blood vessels. AFR is with lateral averaging of . (c) An example showing incorrect fitting caused by vessels, from the zone marked by the lower of the purple squares in (b). (d) and (e) Longitudinal parametric attenuation coefficient imaging of a human burn scar before and after laser treatment with vascular masks shown in black. AFR is with lateral averaging of . Adapted from Refs. 35 and 69.

