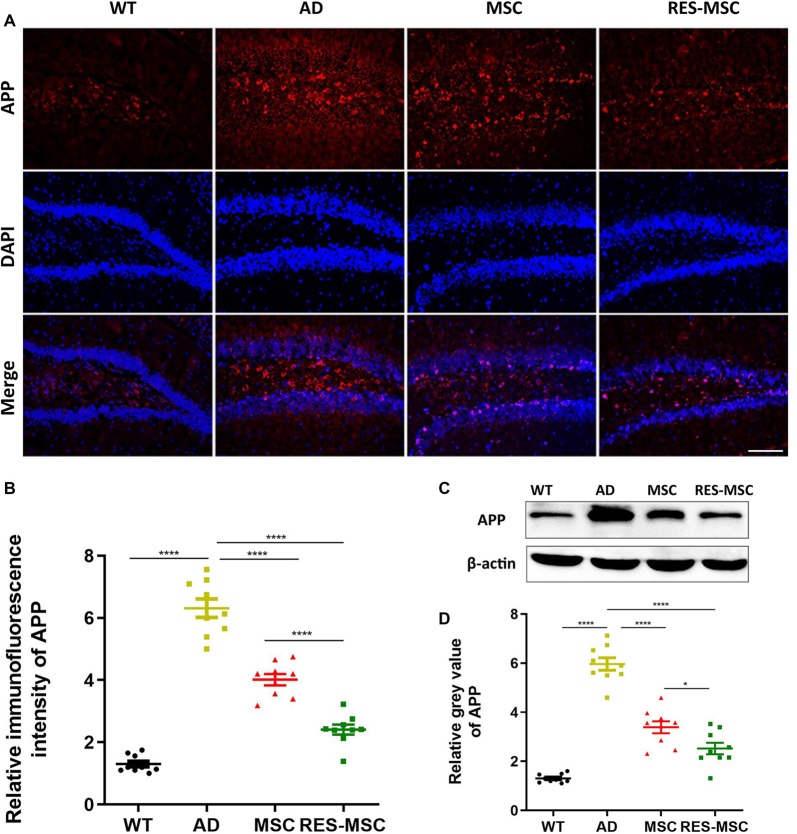
Figure 5.
MSCs and RES-MSCs regulated the expression of APP in mouse hippocampus. (A) Representative immunohistochemical images and (B) the relative fluorescence intensity of APP immunostaining in the hippocampus. Scale bar = 50 μm. The area of positive immunofluorescence was analyzed. Data were derived from three mice in each group and from three sections of each mouse (n = 9). Results were expressed as mean ± SEM and analyzed by ANOVA plus Bonferroni (WT vs. AD p < 0.0001, MSC vs. AD p < 0.0001, RES-MSC vs. AD p < 0.0001, MSC vs. RES-MSC p < 0.0001). (C) Representative images of Western blotting of APP (D) The gray values of the Western blotting of APP were analyzed from three mice in each group and from three independent experiments from each mouse (n = 9). Results were expressed as mean ± SEM (ANOVA plus Bonferroni: WT vs. AD p < 0.0001, MSC vs. AD p = 0.1854, RES-MSC vs. AD p < 0.0001, MSC vs. RES-MSC p = 0.0443). *p < 0.05, ****p < 0.0001.

