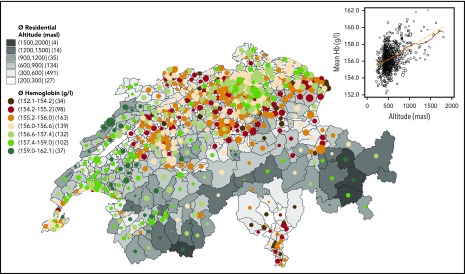
Figure 1.
Hemoglobinography: Hb concentrations mirror the topography of Switzerland. Map of 705 MedStat regions that represents the official geographical regions, allowing an anonymous indication of a place of residence for each person hospitalized in Switzerland. The map shows the conscripts’ average residential altitude, as well as average Hb level (circle size proportional to sample size, Nmin = 12, Nn < 30 = 12, Nmax = 335, Nmean = 102). The numbers in parentheses following the altitudes in the legend key indicate the number of MedStat regions in that particular category. The scatterplot (inset) shows the same MedStat data (altitude vs Hb). The solid red line indicates a smoothed local polynomial trend (bandwidth = 100 masl), the yellow dashed line is a linear fit, and the size of the circle is proportional to sample size.

