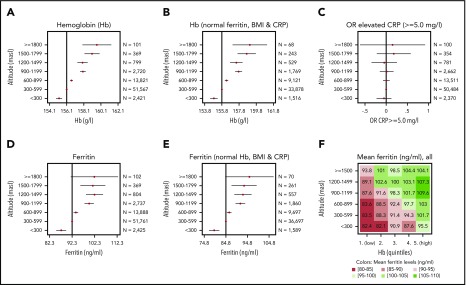
Figure 2.
Regression results of blood parameters at increasing altitute. Coefficient plots showing the linear regression results for residential altitude as explanatory variable against Hb (A), Hb for conscripts with normal ferritin (15-200 ng/mL), CRP (<5.0 mg/L), and BMI (18.5-24.9 kg/m2) only (B), ferritin (D), and ferritin for conscripts with normal Hb (<175 g/L), CRP (<5.0 mg/L), and BMI (18.5-24.9 kg/m2) only (E). (C) Odds ratios (OR) for elevated CRP (≥5.0 mg/L) were calculated using logistic regression. The vertical lines indicate the reference levels (constant, intercept, α) of the regressions, and the point estimates with 95% confidence intervals indicate the coefficients (β). Detailed results for regression (A, B, D, and E) can be found in supplemental Table 3. The robustness of these associations was checked in a sensitivity analysis by stratifying for age, occupational background, and recruitment centers (supplemental Figure 2). (F) Matrix plot of average ferritin levels (all blood test participants) by altitude and quintiles of Hb (first quintile is the lowest 20% of Hb values, fifth quintile is the highest 20% of Hb values).

