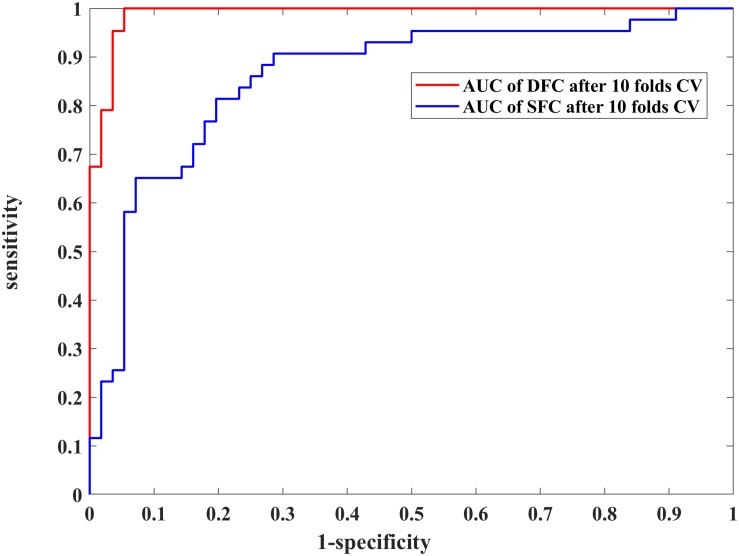
FIGURE 3.
Performance comparison of the 28 selected dynamic functional connectivity (DFC)-based features and 14 selected static functional connectivity (SFC)-based features with a non-linear support vector machine (SVM) classifier and 10-fold cross validation (CV) strategy. The blue and red curves represent the receiver operating characteristic (ROC) curves of using the 28 and 14 optimal features, respectively.

