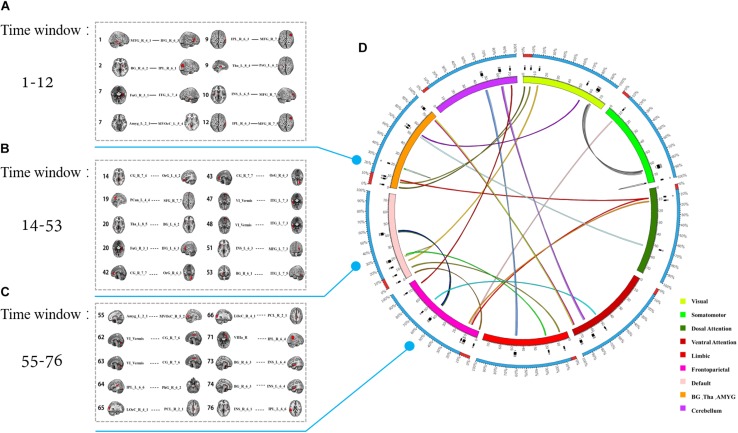
FIGURE 5.
The temporal distribution of the 28 most discriminative dynamic connections after feature selection. (A–C) The connections in different time windows. (D) The color of the inner circle represents the brain network that the node belongs to. The lines in the circle represent the connections, and the color of the connections represents different windows.

