
Figure 2.
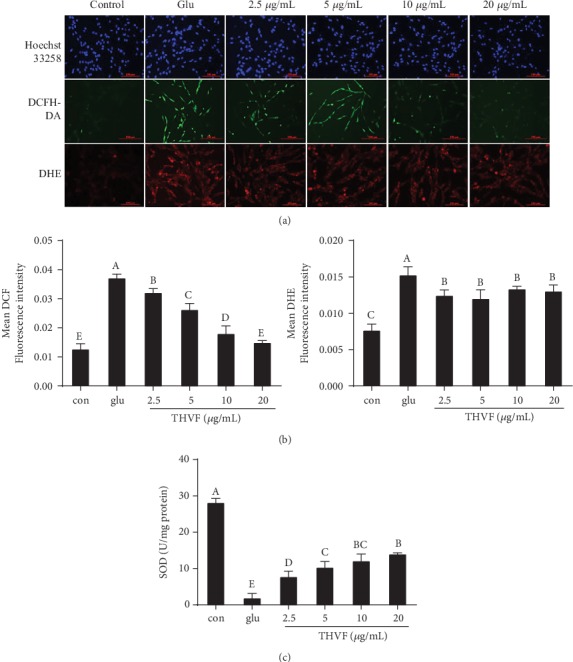
Effects of THVF on Glu-induced oxidative damage in PC12 cells (n = 3). (a) Hoechst 33258, DCFH-DA, DHE staining for genotoxicity, ROS, and O2−. (b) The quantitative data of panel DCFH-DA and DHE. (c) SOD activity of PC12 cells with or without Glu and THVF treatments. THVF-treated cells were inoculated in different concentrations of THVF for 24 hours, and then, 20 mM Glu was added for a total of 24 hours. Cells without Glu and THVF were used as negative control group. Cells treated with Glu alone were used as a glu group. Images were captured with a fluorescence microscope in the same settings. All the fluorescence images were quantified in the whole field with the background removed and represented by normalized fluorescence (y-axes) via Image-Pro Plus 6.0 (n = 3). Significance analysis was carried out according to the one-way ANOVA test, and different letters in figures mean statistically significant differences among the groups (a, b, c, etc., were labeled from large to small and once columns containing a same word means statistically insignificant, otherwise means statistically significant, p < 0.05).