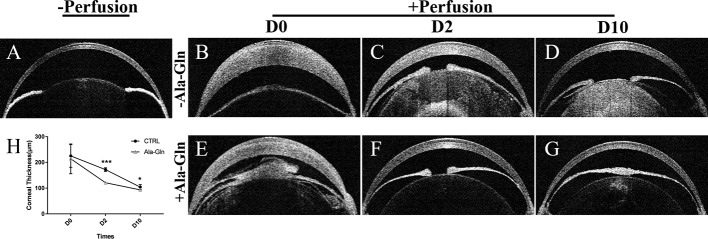
Figure 3.
Evaluation of the central corneal thickness by OCT. Representative images demonstrate the central corneal thickness pre-irrigation (A) and post-irrigation in the Ringer’s (B–D) or Ala-Gln (E–G) group at different time points. (H) Comparative analysis shows an increased central corneal thickness in the Ringer’s group than the Ala-Gln group at different time points after irrigation. Data are represented as mean ± SEM. *P < 0.05, ***P < 0.001. (n = 3/group).

