
Figure 6.
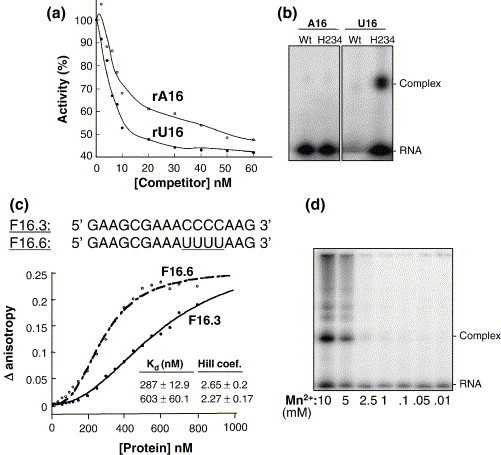
Nsp15-RNA interaction. (a) Inhibition of rU cleavage assay by RNAs rA16 or rU16. Increasing amounts of competitor RNAs (rA16 or rU16) were added to the reactions, allowed to equilibrate for 10 s and monitored for rate of cleavage. (b) Image of an SDS/polyacrylamide gel where kinased RNAs (identities of which are indicated above the lanes) were UV-crosslinked as described above to 500 ng of either WT or H234A mutant proteins. The mix contained an equal amount of BSA as a control for non-specific crosslinking. (c) Analysis of H234A-RNA interaction using fluorescence anisotropy. The anisotropy change was measured with increasing concentrations of H234A. Each datum point represents the average of ten anisotropy values. The Kd for the interaction and Hill coefficient (H.C) were derived from the binding isotherm using the Hill equation, as described in Materials and Methods. (d) SDS-PAGE image of radiolabeled rU16 crosslinked to H234A in the presence of increasing concentrations of MnCl2.