
Figure 8.
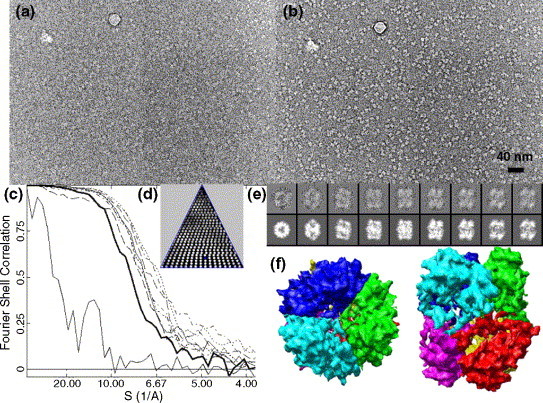
Cryo-EM 3D reconstruction of Nsp15 K289A. (a) Close to focus (1.5 μm) image of Nsp15. (b) Far-defocus (5.5 μm) image of the same area. (c) Refinement process monitored by Fourier shell correction. EOTEST is shown as a thick line. (d) The asymmetric triangle shows the orientation of the particles. (e) Upper row: class average of the particles; bottom row: reprojection from the final 3D model. (f) Surface display of the 3D structure, showing the six subunits in different colors. The figures to the left and right are the top and side views of the hexamer.