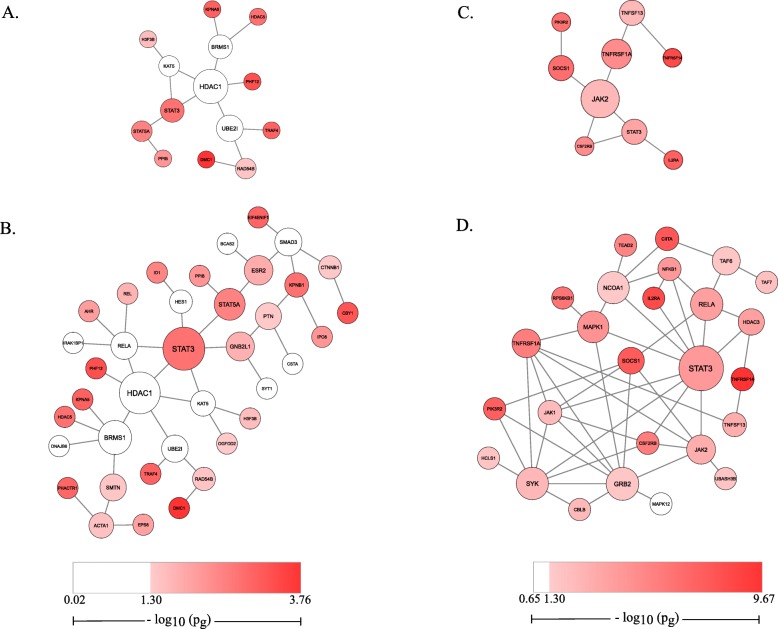
Fig. 2.
Top modules associated to GeneMSA GWAS and IMSGC GWAS. The top module of GeneMSA GWAS displays HDAC1 as central (a). The top 10 modules of GeneMSA were merged (b). The top module of IMSGC GWAS shows JAK2 as central (c). The top 10 modules of IMSGC were merged (d). Large nodes represent central genes and small nodes represent less central genes (based on measure of Betweenness). Colors of nodes represent Pascal reported gene-level p-values as specified by legend

