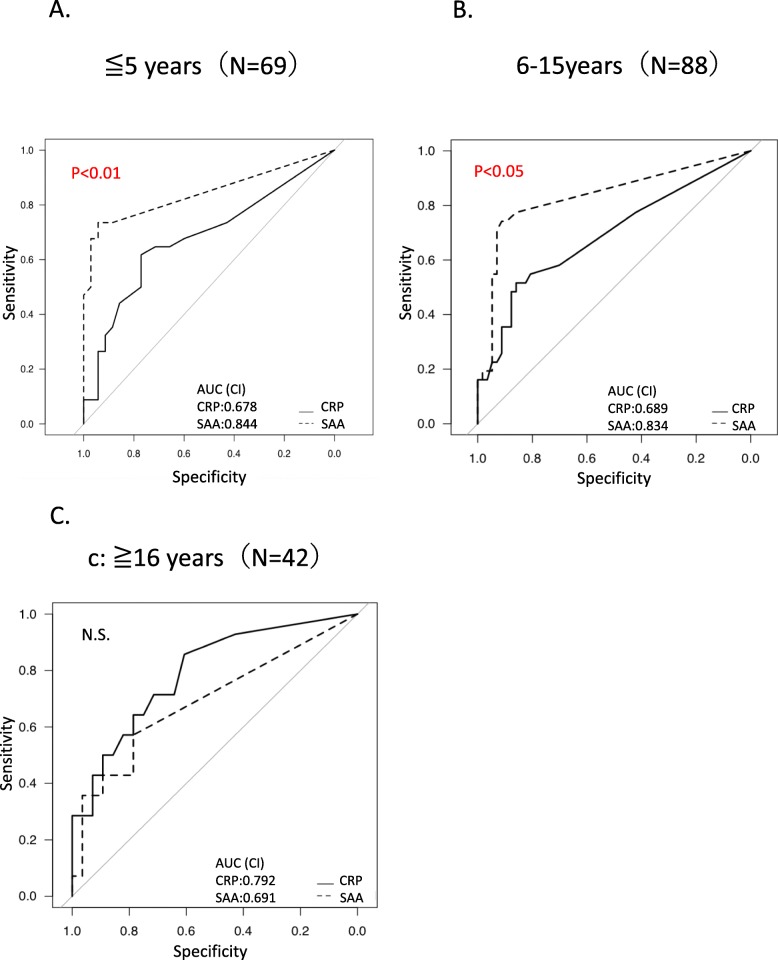
Fig. 4.
Comparison of ROC curves of mucosal inflammation (MES 2 or 3) of SAA and CRP when divided by disease duration. The ROC curves of SAA and CRP in patients in clinical remission when divided by disease duration. Disease duration was divided into three groups: 0–5 years (N = 69), 6–15 years (N = 88), and more than 16 years (N = 42). When examined by disease duration, comparison of ROC curves for mucosal inflammation (MES 2 or 3) of SAA and CRP showed that SAA was superior and indicated statistical significance in groups with disease duration of 0–5 years and 6–15 years. On the other hand, no statistical significance was shown in the group with disease duration of 16 years or more. AUC, area under the receiver’s operating characteristic curve; CRP, C-reactive protein; MES, Mayo Endoscopic Score; SAA, serum amyloid A

