Fig. 1.
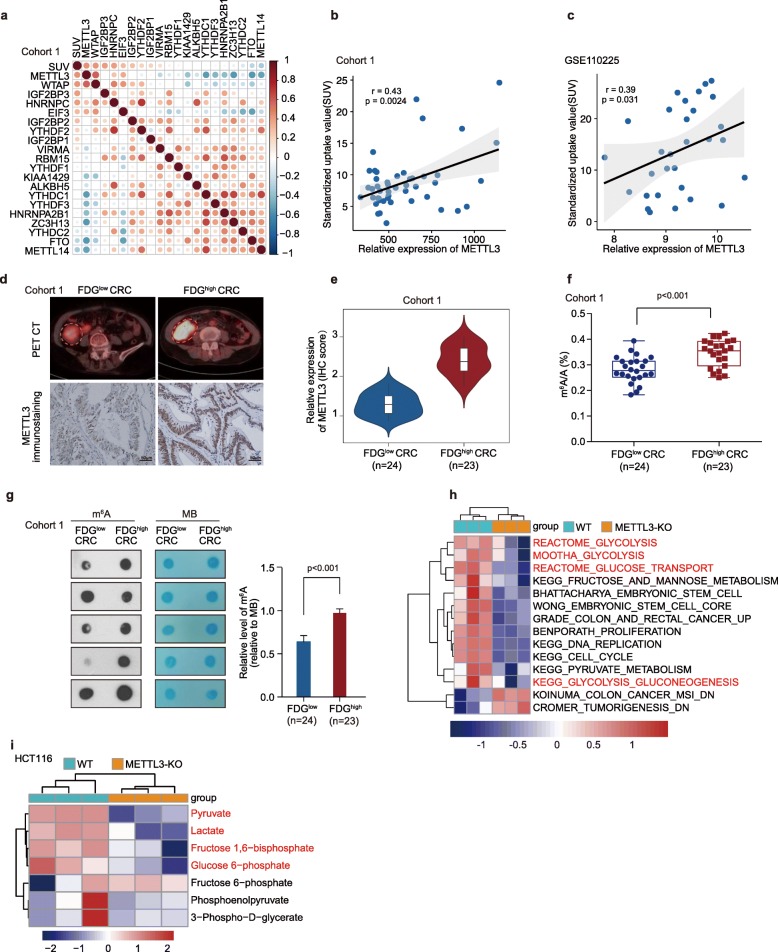
METTL3 is closely correlated with glycolytic metabolism in CRC. (a) The correlation matrix showed the relationship between the expression of m6A genes and SUVmax (FDG maximal standardized uptake value) in 47 CRC patients of Cohort 1. (b) Correlation between FDG uptake (SUVmax) and METTL3 expression in 47 CRC patients of Cohort 1. (c) Correlation between FDG uptake (SUVmax) and METTL3 expression in 30 CRC patients of another independent cohort (GSE110225). (d) Representative PET/CT images and METTL3 immunohistochemical images of CRC patients with FDG high uptake and FDG low uptake in Cohort 1. (e) Statistical analysis of METTL3 expression in CRC patients with FDG high uptake and patients with FDG low uptake, nonparametric Mann-Whitney test. (f) LC-MS/MS quantification of the m6A/A ratio in poly(A) RNA isolated from CRC patients with FDG high uptake or FDG low uptake in Cohort 1, nonparametric Mann-Whitney test. (g) Representative images and relative quantitative information of m6A dot blot assay showed global m6A abundance in CRC patients with FDG high uptake or FDG low uptake in Cohort 1. MB, methylene blue staining (as a loading control). (h) ssGSEA analysis was performed to show the pathways closely correlated with METTL3 expression levels in CRC cells; n = 3. (i) LC-MS/MS-based analysis showed the major metabolites altered in the glycolytic pathway in HCT116 METTL3-KO cells relative to WT cells. The differentially expressed metabolites (p < 0.05) were highlighted in red; n = 3. (WT, wild type; METTL3-KO, METTL3-knockout)

