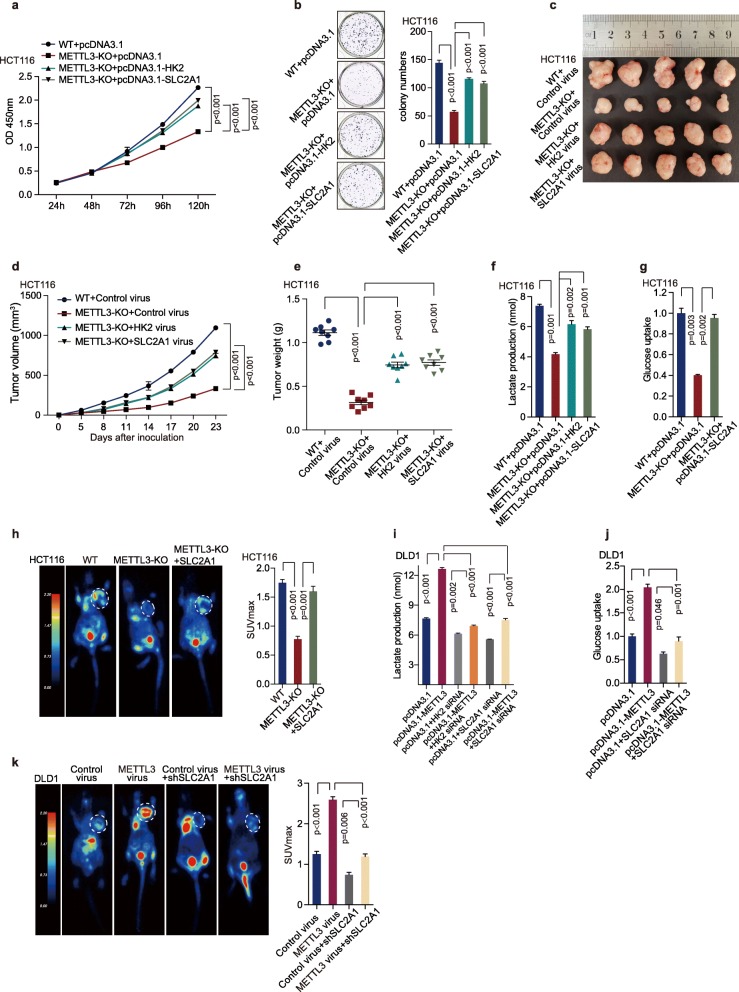
Fig. 6.
HK2 and SLC2A1 were functionally important target genes of METTL3 in CRC. (a-b) CCK8 assays (a) and Colony formation assay (b) were measured after transfection with pcDNA3.1, pcDNA3.1-HK2 and pcDNA3.1-SLC2A1 plasmid in HCT116 WT and METTL3-knockout cells. Nonparametric Mann–Whitney test. (c-e) Representative images of tumors (c), statistical analysis of tumor volumes (d) and tumor weights (e) in nude mice bearing HCT116 cells in different groups (n = 8, nonparametric Mann–Whitney test). (f) Lactate production assay was performed after transfection with pcDNA3.1, pcDNA3.1-HK2 and pcDNA3.1-SLC2A1 plasmid in HCT116 WT and METTL3-KO cells, n = 3, Nonparametric Mann–Whitney test. (g) Glucose uptake was measured after transfected with pcDNA3.1, and pcDNA3.1-SLC2A1 plasmid in HCT116 WT and METTL3-knockout cells, n = 3, Nonparametric Mann–Whitney test. (h) Representative images of 18F-FDG uptake by micro-PET imaging in nude mice bearing HCT116 cells in different groups. White circles indicated tumor glucose uptake. Maximum uptake values (SUVmax) for xenografts measured by FDG-PET were presented; nonparametric Mann–Whitney test. (i) Lactate production assay was performed in DLD1 cells with different treatment, n = 3, nonparametric Mann–Whitney test. (j) Glucose uptake was detected in DLD1 cells with different treatment, n = 3, nonparametric Mann–Whitney test. (k) Representative images of 18F-FDG uptake by micro-PET imaging in nude mice bearing DLD1 cells in different groups. White circles indicated tumor glucose uptake. Maximum uptake values (SUVmax) for xenografts measured by FDG-PET were presented; nonparametric Mann–Whitney test. Fig. 2k and Fig. 6k shared experimental controls and METLL3-overexpression group. (WT, wild type; METTL3-KO, METTL3-knockout)

