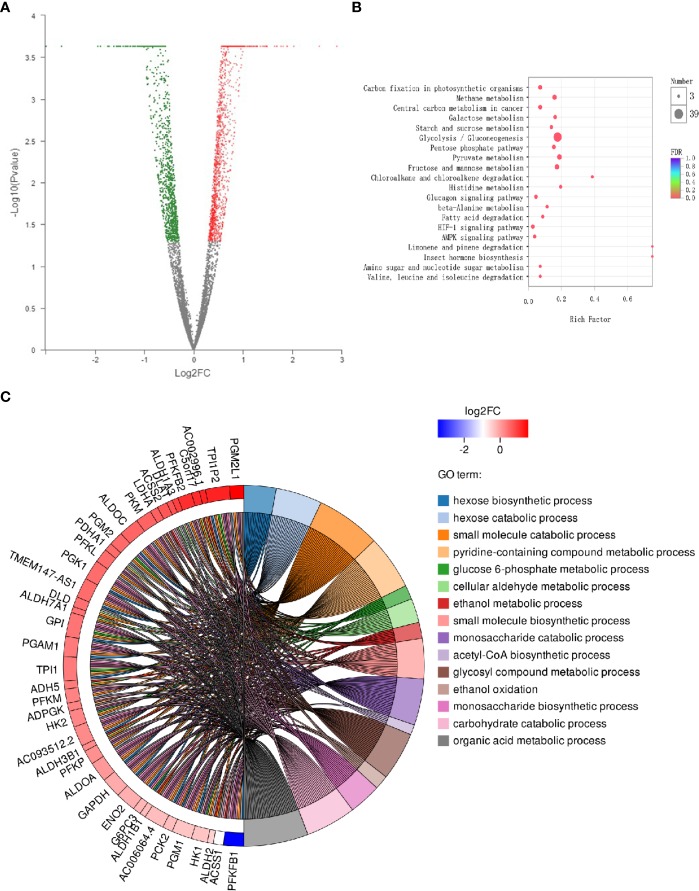
Figure 1.
Differential expression of cancer-related genes following administration of esculetin (each group, n=3). (A) A volcanic map. Each dot represents a specific gene; red dots are significantly up-regulated genes, blue dots significantly down-regulated genes, and black dots represent non-significantly differentially expressed genes. The point on the left is the gene with a down-regulated expression difference, and the point on the right is the gene with an up-regulated expression difference. (B) KEGG enrichment analysis of cancer-related genes. The colors of the dots correspond to different Q value ranges. (C) GO enriched string diagrams. The larger log2FC, the larger the expression difference of up-regulated genes; the smaller log2FC is, the larger the expression difference of down-regulated genes; and the closer log2FC is to 0, the multiple of a genes differential expression was smaller. GO term information on the significant enrichment of differentially expressed genes is on the right.

