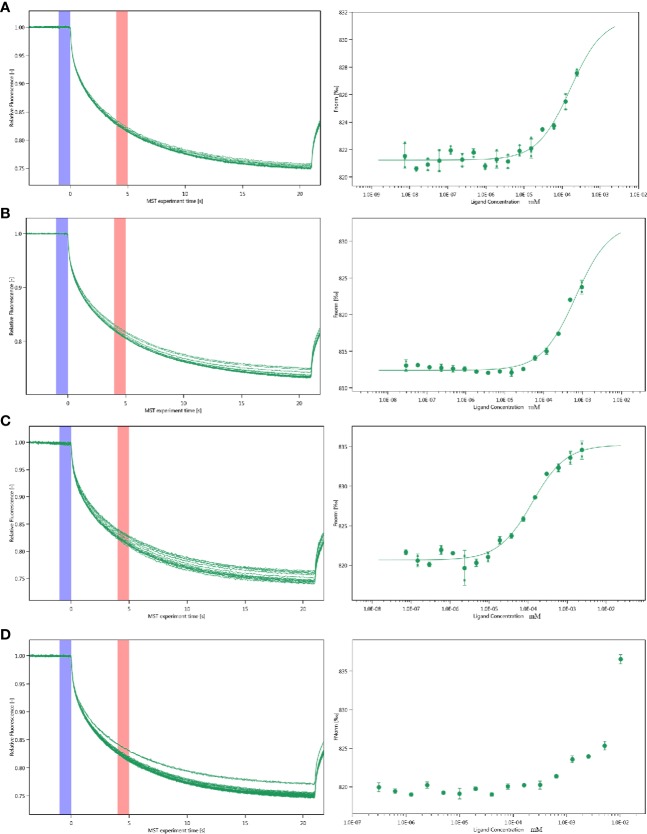
Figure 5.
Molecular interactions of esculetin by NT. 115 analysis. MST time traces of esculetin at 16 different concentrations, from 7.48 × 10⁻⁶ to 0.245 mM (A) PGK2 (5.32 µM), Kd=161.0 ± 63.28 nM (B) GPD2 (0.02 µM), Kd=666.14 ± 196.12 nM (C) GPI (0.5 µM), Kd=127.36 ± 22.36 nM (D) BSA (0.945 µM), failed, MST signal measured 30 s after heating turned on (n=3).

