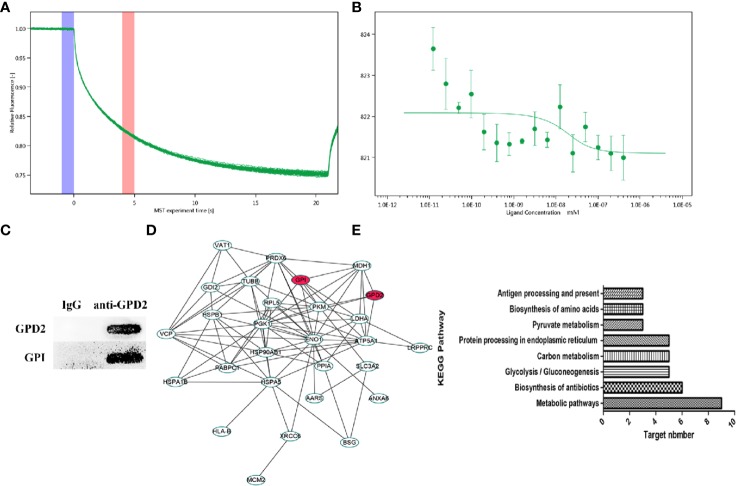
Figure 6.
(A, B) MST time traces of 16 different GPI concentrations (1.23 × 10⁻⁵ to 0.403 µM) with a fixed concentration of GPD2 (0.02 µM), Kd = 8.59 ± 32.05 nM. MST signal measured 30 s after heating turned on (n=3). (C) The coimmunoprecipitated proteins were detected by western blot. (D) PPI network of differentially proteins. (E) Cancer-related signaling pathways associated with differentially proteins.

