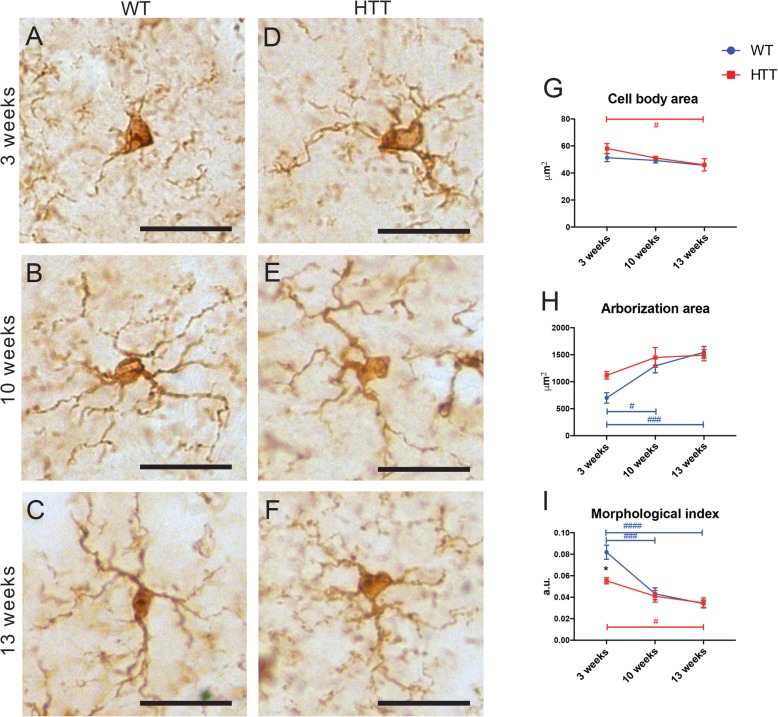
Fig. 2.
Microglial morphometric changes observed in the striatum over the course of HD pathology. Picture example showing microglial morphology captured by brightfield microscopy in WT mice at 3 weeks (a), 10 weeks (b), and 12 weeks (c) of age and R6/2 (HTT) mice at 3 weeks (d), 10 weeks (e), and 13 weeks (f) of age, identified using anti-IBA1 staining. Scale bar = 5 μm. Quantitative analysis of microglial cell body area (g), arborization area (h), and morphological index (i) performed at all three ages in both WT and HTT conditions. N = 4 animals per condition. Asterisk denotes the difference from WT, blue number sign denotes the difference between ages in WT mice, red number sign denotes the difference between ages in R6/2 mice; *,#p < 0.05, ###p < 0.001, ####p < 0.0001

