
Fig. 3.
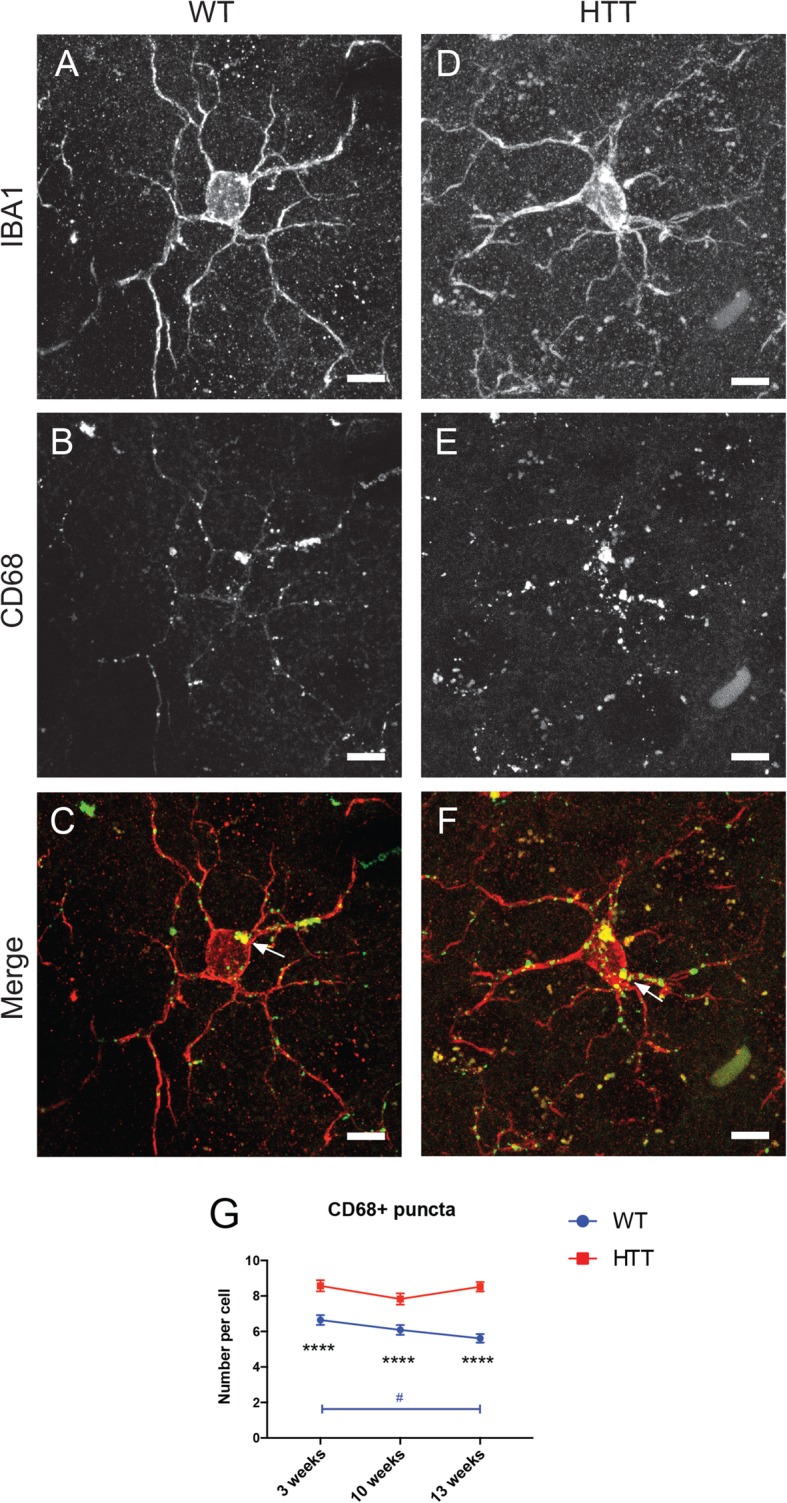
Microglial phagocytosis increases in the striatum over the course of HD pathology. Picture examples of 13-week-old WT (a–c) and R6/2 (d–f, HTT) mouse microglia costained with IBA1 (a, d) and the phagolysosomal marker CD68 (b, e). Merged images display phagolysosomes (white arrows) within the microglial cell bodies (c, f). Scale bar = 5 μm. Statistical analysis (g) of the number of CD68+ puncta per microglial cell body. n = 20–27 cells per animal for all conditions, and data was collected from N = 3–4 animals per condition. Asterisk denotes the difference from WT, blue number sign denotes the difference between ages in WT mice; #p < 0.05, ****p < 0.0001