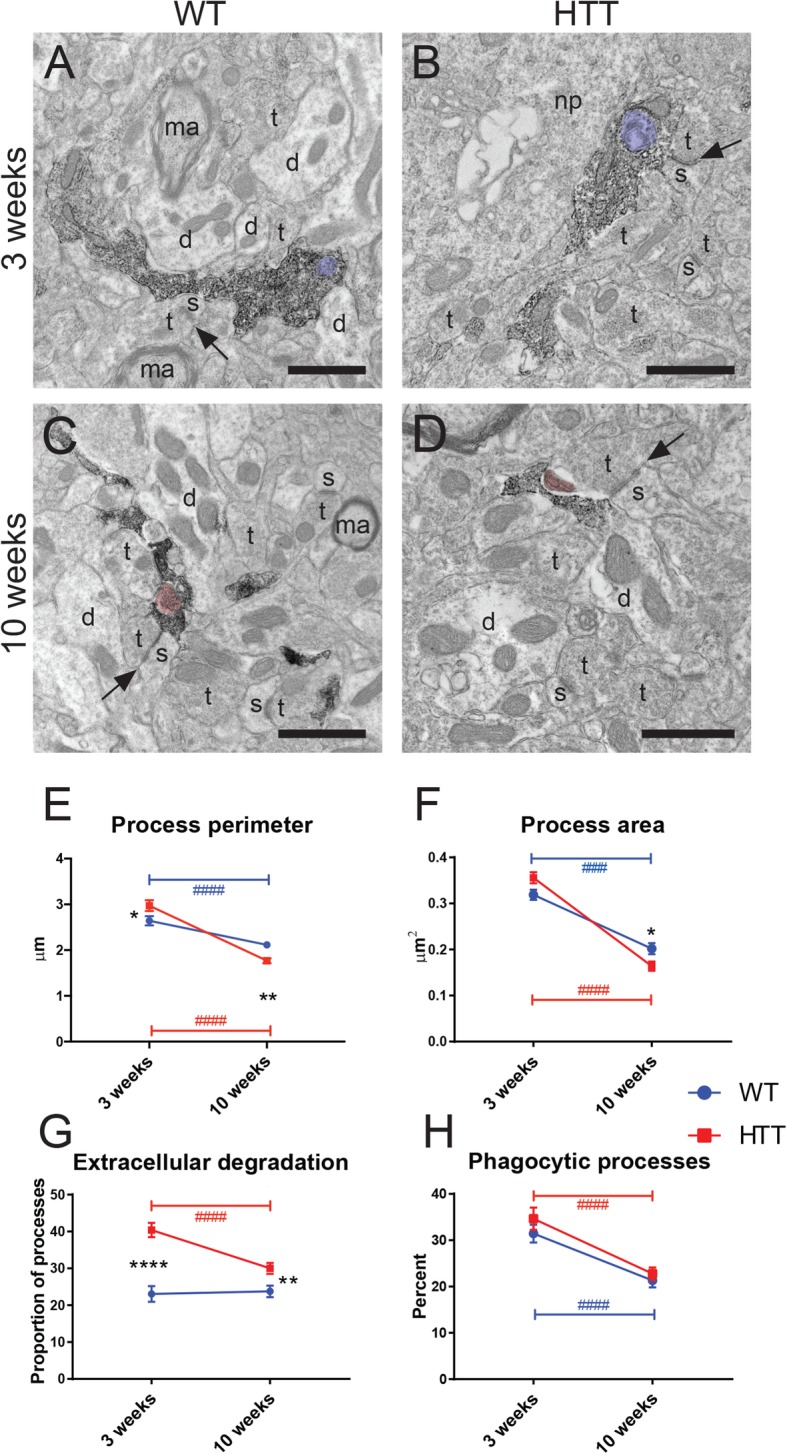
Fig. 5.

Altered microglial process ultrastructure observed in dorsomedial striatum during HD pathology. Electron micrograph examples of microglial processes from 3-week-old WT (A) and R6/2 (B) mice, as well as 10-week-old WT (C) and R6/2 (D) mice displaying IBA1+ immunoreactivity. The perimeter (E) and area (F) of microglial processes were calculated. The percentages of microglial processes surrounded by pockets of extracellular space containing degraded elements or debris (termed “extracellular degradation”; G) or containing phagocytic endosomes (H) was determined. Annotations are as follows: d, dendrite; ma, myelinated axon; np, neuronal perikaryon; s, dendritic spine; t, axon terminal. Black arrows point to excitatory synaptic clefts. Extracellular degradation is pseudocolored in pink; phagosomes are pseudocolored in purple. Scale bar = 500 nm, n = 70–100 microglial processes per animal for all conditions, N = 3–4 animals per condition. Asterisk denotes the difference from WT, blue number sign denotes the difference between ages in WT mice, red number sign denotes the difference between ages in R6/2 mice; *p < 0.05, **p < 0.01, ****,####p < 0.0001
