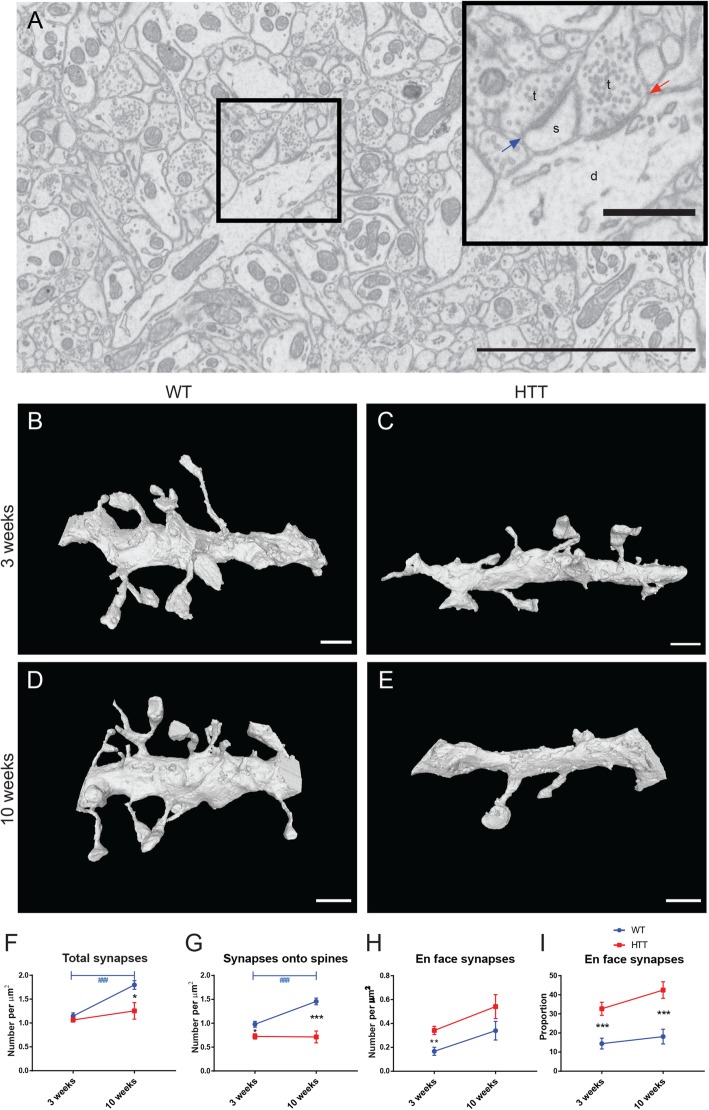
Fig. 7.
Synaptic density in dorsomedial striatum during HD pathology. A single image from the 125-μm3 3-dimensional FIB-SEM stack (A) displays dense neuropil containing many dendrites, dendritic spines, and axon terminals. The dendrite (d) in the insert displays an en face synaptic contact from an axon terminal (t, red arrow) and a postsynaptic dendritic spine (s) directly contacted by an axon terminal (blue arrow). FIB-SEM was performed to create 125-μm3 images from 3-week-old WT (B) and R6/2 (C) and 10-week-old WT (D) and R6/2 (E) mice. Dendrites were traced using Ilastik and rendered using meshlab software. The number of synapses was calculated for each dendrite and normalized to their length (F). The number of synapses onto dendritic spines (G) and directly made onto the dendrite itself (H) was calculated and normalized to dendritic length. The proportion of en face synapses was calculated for each dendrite and averaged (I). Scale bar = 5 μm in A, 1 μm in insert, 1 μm in B–E. n = 3–6 dendrites per animal, N = 3–4 animals per condition. Asterisk denotes difference from WT, blue number sign denotes difference between ages in WT mice; *p < 0.05, **p < 0.01, ***,###p < 0.001

