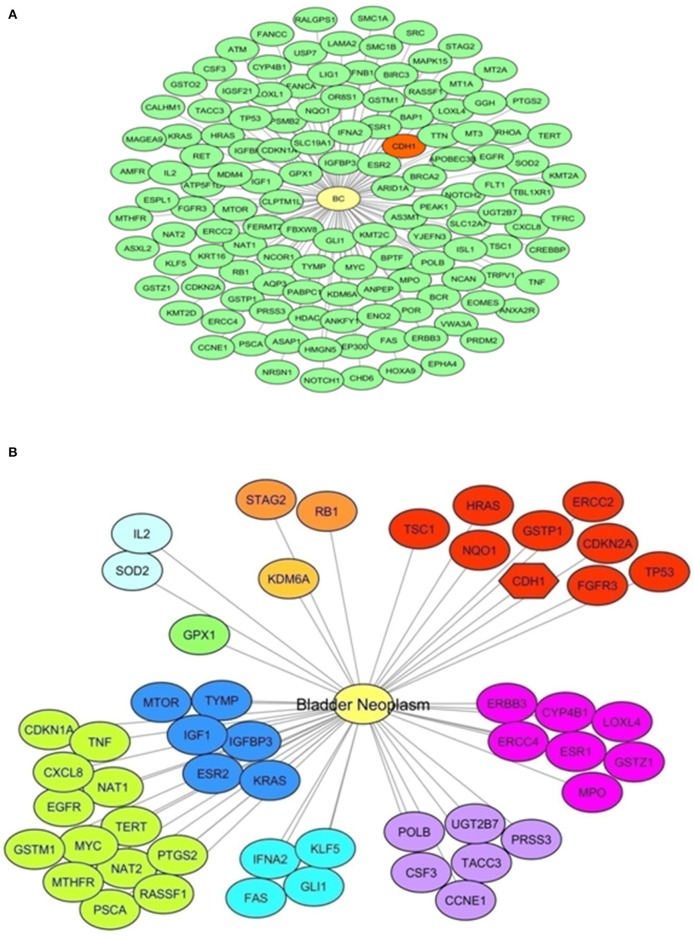
Figure 1.
E-cadherin and Bladder Cancer. A bioinformatics survey. (A) Network representation of genes annotated to the terms “Malignant neoplasm of urinary bladder,” “Bladder Neoplasm,” “Transitional cell carcinoma of bladder,” “Carcinoma in situ of bladder,” and “Carcinoma of bladder” obtained with DisGeNET using Cytoscape. A yellow node represents the “Bladder Cancer” disease node. Green nodes represent disease-related genes (130 genes). In red, the CDH1 gene is highlighted. (B) Network representation of genes annotated to the term “Bladder Neoplasm” obtained with DisGeNET using Cytoscape. A yellow node represents the Bladder Cancer disease node. Other nodes represent disease-related genes, showing same colors for equal score. Red colored nodes depict the highest score (0.6); the CDH1 gene is among these genes and highlighted with a different node shape. Information on the score and association type is presented in Supplementary Table 3.

