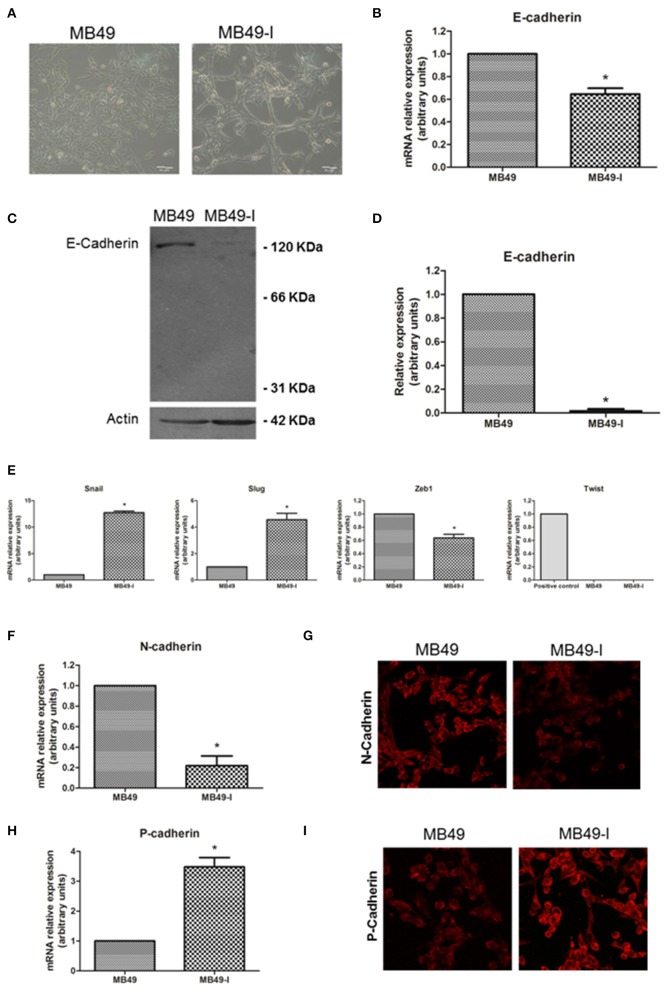
Figure 2.
EMT molecules and BC. Studies in the MB49 and MB49-I cell murine models. (A) Phase contrast microscopy of MB49 and MB49-I cells. Graph Bar = 20 μm. (B) Quantitative analysis of E-cadherin mRNA in MB49 and MB49-I cells by real-time PCR. Results are plotted as mean relative expression with Standard Error of the Mean (SEM); *P < 0.05. (C) Immunodetection of E-cadherin protein forms in total protein extracts of MB49 and MB49-I cells after performing 10% polyacrylamide gel electrophoresis (SDS-PAGE) followed by Western immunoblotting with anti E-cadherin antibody (610181; 2.5 μg/ml). Actin (I-19; 2 μg/ml) was used as loading control. References indicate the molecular weight standards of 66 and 31 KDa and the 120 KDa E-cadherin full length form. (D) Densitometric analysis of results obtained by Western Immunoblotting for the expression of E-cadherin performed with the ImageJ program; results are shown as percentage of the expression level of CadE in line MB49-I. Assessments of 3 replicates were included in the analysis. Data is shown as mean ± SEM. (E) Quantitative analysis by real-time PCR of Snail, Slug, Zeb1, and Twist mRNA expression in MB49 and MB49-I cells. For Twist, mouse testis was used as a positive control. ns, not significant; *P < 0.05. (F) Quantitative analysis by real-time PCR of N-cadherin mRNA expression in MB49 and MB49-I cells. (G) Fluorescence immunocytochemistry analysis by confocal laser microscopy of N-cadherin (H-63; 2 μg/ml) in MB49 and MB49-I cells. Negative controls are shown on the right, and cell nucleae were visualized using HOESCHT 33342. (H) Quantitative analysis by real-time PCR of P-cadherin mRNA expression in MB49 and MB49-I cells, *P < 0.05. In all cases, relative expression levels of each mRNA was calculated using actin as endogenous gene and the MB49 cell line as reference. (I) Fluorescence immunocytochemistry analysis by confocal laser microscopy of P-cadherin (H-105; 2 μg/ml) in MB49 and MB49-I cells. Negative controls are shown on the right, and cell nucleae were visualized using HOESCHT 33342.

