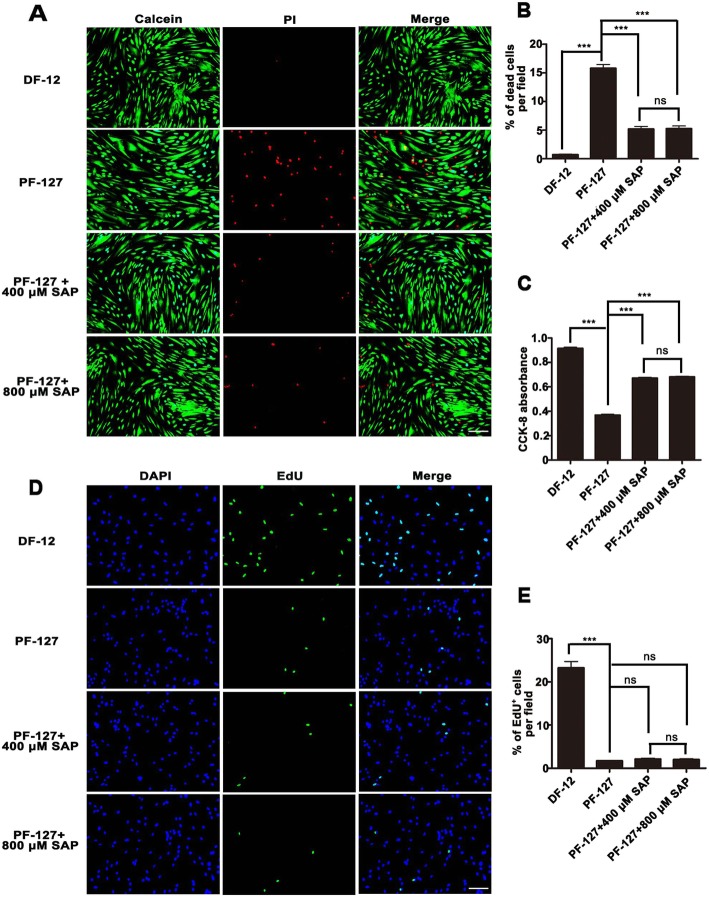
Fig. 2.
SAP improves Wharton’s jelly mesenchymal stem cell survival in PF-127 encapsulation. a Fluorescence images of WJMSC survival after 24 h culture, as tested by Live/Dead TM Cell Imaging Kit. Calcein staining (green) represents live cells while PI staining (red) represents dead cells. Scale bar, 400 μm. b Quantitation data of the percentage of dead cells per field. n = 3. c Quantitation data of relative cell viability in different groups after 24 h culture, as evaluated by CCK8 testing. n = 6. d Fluorescence images of WJMSC proliferation after 24 h culture, as tested by Cell Light TM EdU Kit. EdU positive (green) represents proliferating cells. Scale bar, 400 μm. e Quantitation data of the percentage of proliferating cells per field. n = 3. In b, c, and e, data were presented as mean ± SD. Statistical analyses were performed by one-way ANOVA followed by Tukey’s post test. ***p < 0.001; ns, no significance

