Fig. 5.
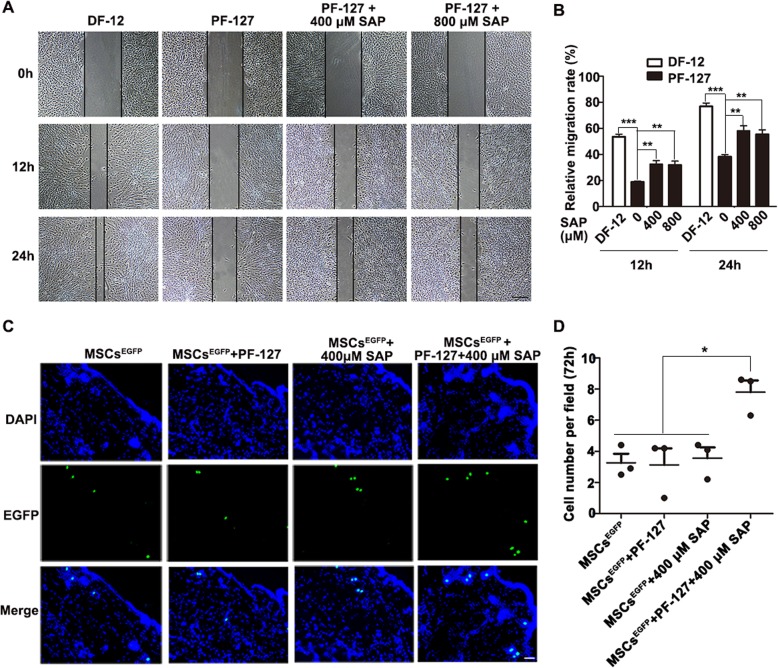
PF-127 plus SAP combination enhances WJMSCs migration in vitro and to the dermis in vivo. a Representative images of cell migration at 12 h and 24 h. Scale bar: 500 μm. b Quantitation data of relative cell migration rate at 12 h and 24 h, (normalized to 0 h). Data were presented as mean ± SD, n = 5. Statistical analyses were performed by one-way ANOVA analysis followed by Tukey’s post test. **p < 0.01, ***p < 0.001. c Representative fluorescence images of EGFP-overexpressing MJMSCs in different groups at 72 h post-transplantation, which was examined by cryo-sectioning. Signals: EGFP, green; DAPI, blue. Scale bar: 50 μm. d Quantitation data of cell number per field at 72 h in different groups. Data were presented as mean ± SD, n = 3. Statistical analyses were performed by one-way ANOVA analysis followed by Tukey’s post test. *p < 0.05

