
Figure I.
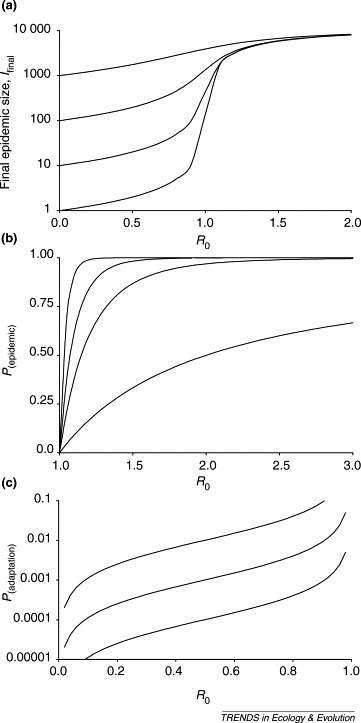
Impact of R0 on the population dynamics of pathogen emergence. (a) Relationship between final epidemic size (log scale) and R0 from Equation I with N =10 000, for I0=1, 10, 100 and 1000. (b) Relationship between the probability of a major epidemic, P(epidemic), and R0 from Equation II, for I0=1, 5, 10 and 25. Redrawn with permission from [17]. (c) Approximate relationship (valid when μ≪1 and R0 is <1 and not too close to 1) between the probability that the pathogen adapts during an outbreak so that R0 becomes >1, P(adaptation), and the original value of R0 from Equation III for μ=0.0001, 0.001 and 0.01. Redrawn with permission from [19].