Fig. 2.
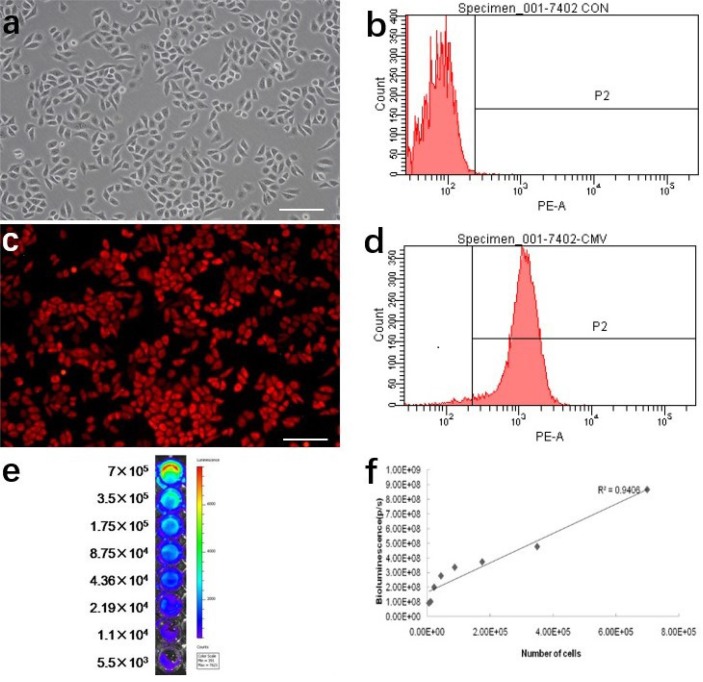
(a, b) Optical image and FACS of H7402 cells. (c, d) High-level expression of mKate2 in H7402 cells was demonstrated by fluorescence microscope and FACS. (e, f) In vitro imaging analysis of stably transduced H7402 cells shows a strong correlation between cell numbers and reporter gene activity. Scale bar represents 100 μm.

