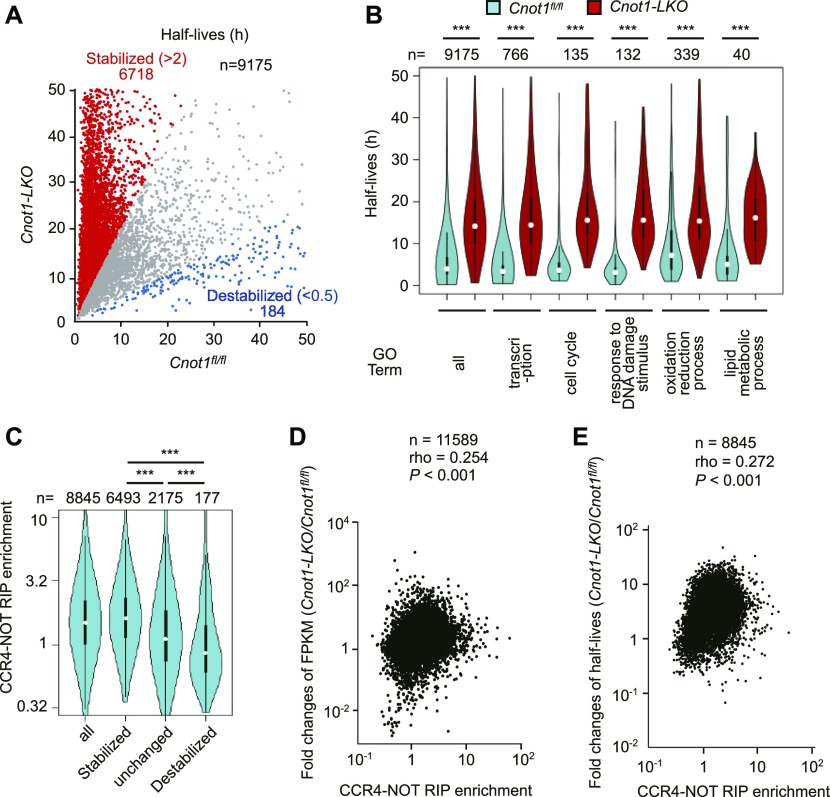
Figure 5. Elongated half-lives of mRNAs in livers from Cnot1-LKO mice, and correlation between mRNA stabilization and RIP enrichment.
(A) Scatterplot of mRNA half-lives in livers from control (Cnot1fl/fl) and Cnot1-LKO mice. Calculation of mRNA half-lives in livers from Cnot1-LKO mice was performed as in Fig 4F (see the Materials and Methods section). mRNAs with half-lives elongated or shortened in livers from Cnot1-LKO mice by more than twofold compared with those from Cnot1fl/fl mice, are shown in red or blue, respectively. (B) Violin plot of half-lives for all mRNAs and those categorized in the indicated GO terms in the livers from control (Cnot1fl/fl) and Cnot1-LKO mice. (C) Violin plot of CCR4–NOT–RIP enrichment values in livers from control (Cnot1fl/fl) mice (means of three independent experiments) for all mRNAs, stabilized, destabilized, and unchanged mRNAs (changes in half-lives: Cnot1-LKO/control >2.0, <0.5, and the others, respectively). (D) Scatterplot of CCR4–NOT–RIP enrichment values and changes in FPKMs in livers (Cnot1-LKO/control). (E) Scatterplot of CCR4–NOT–RIP enrichment values and changes of mRNA half-lives in livers (Cnot1-LKO/control). (D, E) Spearman’s rank correlation coefficient (rho) and P-value were calculated (D, E). (B, C) Wilcoxon signed-rank test (B) and Wilcoxon rank sum test (C) were used. *P < 0.05, **P < 0.01, ***P < 0.001.

