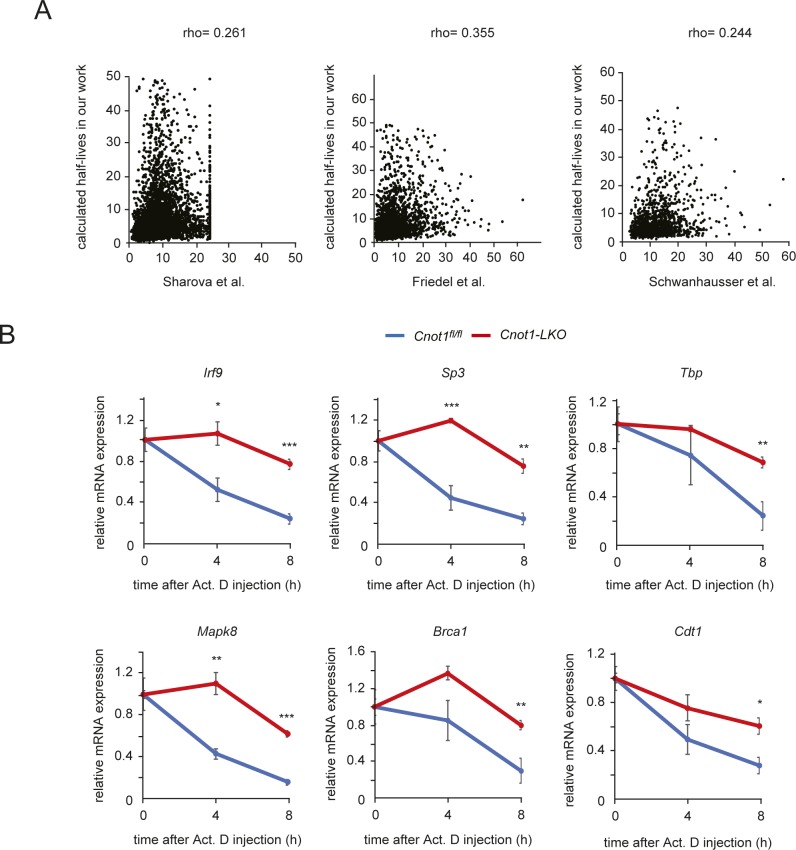
Figure S6. Characterization of Act. D chase experiments in mice.
(A) Comparison of mRNA half-lives with other data. Scatterplot of half-lives (h) measured in mouse cells and those measured in mouse livers. Pearson’s correlation coefficient was used to quantify the strength of association between data and to evaluate statistical significance. (P < 0.001). Rho values in “Sharova et al (2009) versus Friedel et al (2009),” “Sharova et al (2009) versus Schwanhausser et al (2011)” and “Friedel et al (2009) versus Schwanhausser et al (2011)” are 0.376, 0.360, and 0.363, respectively (Friedel et al, 2009; Sharova et al, 2009; Schwanhausser et al, 2011). See the Materials and Methods section for calculating half-lives using RNA-seq. (B) Decay curves of selected mRNAs obtained from RNA-seq results. Gene FPKMs determined by RNA-seq were normalized to the Rplp0 FPKM. mRNA level without Act. D treatment (0 h) was set to one. Values in graphs represent means ± SEM. 0 h (no injection, n = 4), 4 h (n = 3 in control, n = 4 in Cnot1-LKO), and 8 h (n = 3 in control, n = 5 in Cnot1-LKO). Unpaired t test, *P < 0.05, **P < 0.01, ***P < 0.001.

