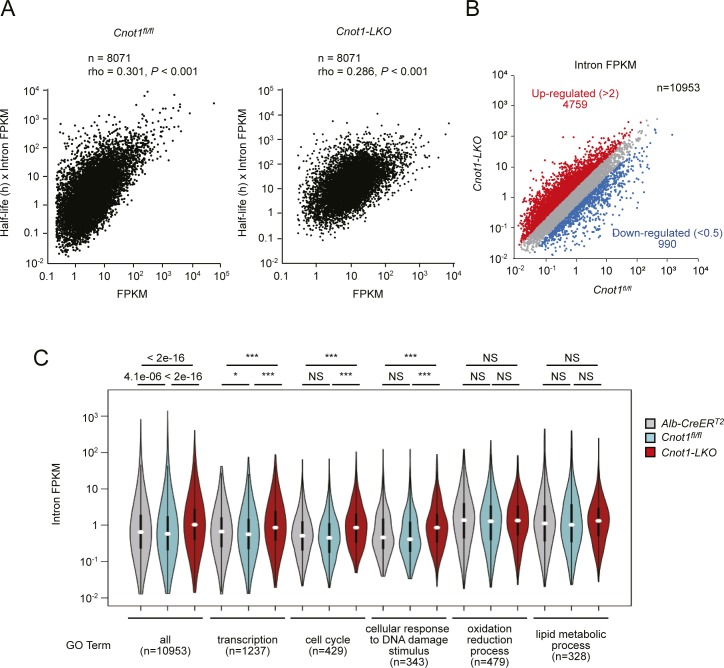
Figure S8. Differential expression of pre-mRNAs in livers between control and Cnot1-LKO mice.
(A) Correlation between measured mRNA levels (FPKM) and calculated levels (mRNA half-life × intron FPKM). Scatterplots of FPKMs obtained from RNA-seq (X axes) and multiplication of mRNA half-lives and intron FPKMs (Y axes) in livers from control (left) and Cnot1-LKO mice (right). The Pearson’s correlation coefficient (rho) and P-value were calculated. (B) Scatterplot of intron FPKMs in livers from control (Cnot1fl/fl) and Cnot1-LKO mice. Each dot represents the mean of four independent samples. Genes that increased or decreased in livers from Cnot1-LKO mice more than twofold compared with those from Cnot1fl/fl mice, are shown in red or blue, respectively. No statistical significance was detected (Mann–Whitney U-test). (C) Violin plot of intron FPKMs for genes categorized in the indicated GO terms in livers from control (Alb-CreERT2 and Cnot1fl/fl) and Cnot1-LKO mice. Means of intron FPKMs in four independent experiments were used. Wilcoxon signed-rank test, *P < 0.05, ***P < 0.001.

