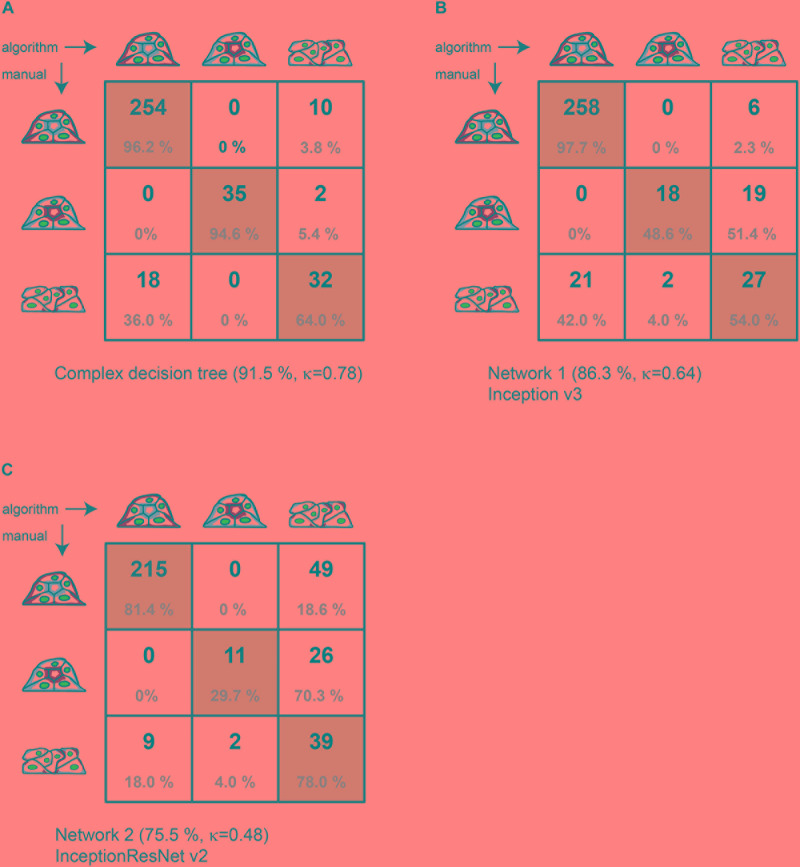
FIGURE 3.
Comparison of manual to automated classification based on a validation data set. Cross-correlation table of “agreed” manual classification versus classification predicted by (A) the complex decision tree classifier, (B) the Inception v3-based CNN, or (C) the InceptionResNet v2-based CNN. Cells with identical classification are highlighted in green. Summary lines indicate overall percentage of agreement and Cohen’s k of interrater agreement.

