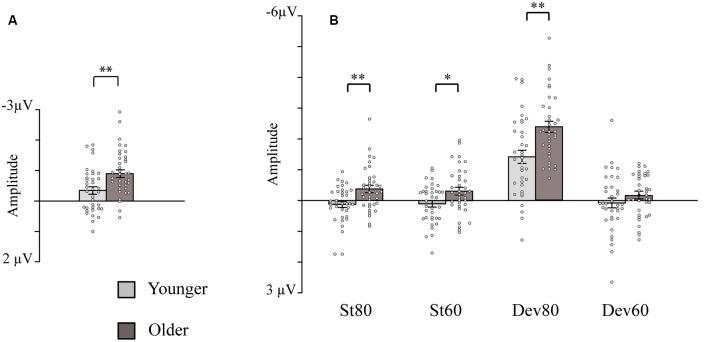
Figure 2.
Bar charts showing the amplitudes of the intensity dependence responses and N1 responses (sensory gating). (A) Intensity dependence: Mean amplitude values for the N1 differential responses (high-intensity standard minus low-intensity standard response). (B) Sensory gating: Mean amplitude values for the N1 responses to the four stimulus types. Mean amplitudes are presented separately for the younger and older groups (depression group collapsed). Error bars represent standard error. *p < 0.05, **p < 0.01. St80, standard sound of 80 dB; St60, standard sound of 60 dB; Dev80, deviant sound of 80 dB; Dev60, deviant sound of 60 dB; Younger, YOUNG and YOUNG-D collapsed; Older, OLD and OLD-D collapsed.

