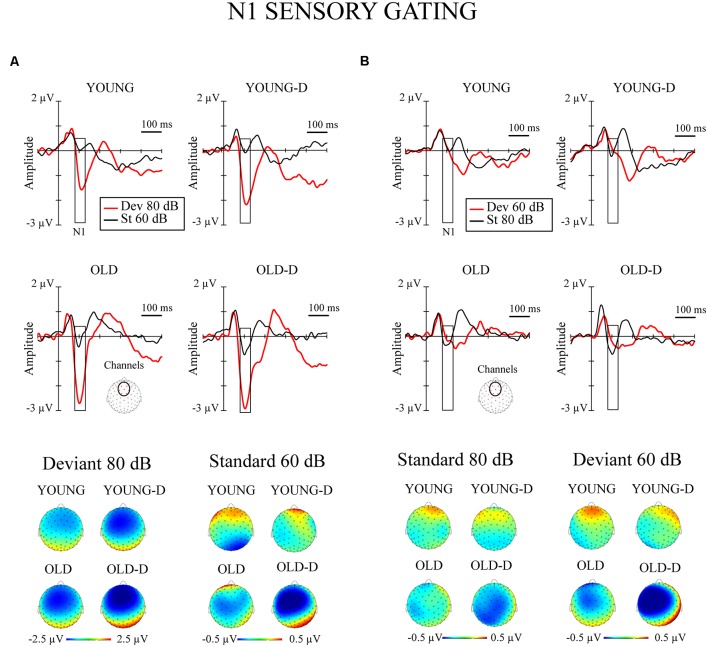
Figure 3.
N1 sensory gating. Grand-averaged waveforms of the N1 responses (sensory gating) from the frontocentral electrode sites (channels) and the corresponding topographical maps. (A) Increment condition. (B) Decrement condition. The rectangles overlaid with the waveforms show the time window applied in the analyses (mean amplitude values between 80 -130 ms after stimulus onset), and the topographies represent the average amplitude over the same time window. The channel cluster applied in the analysis is marked to the figure below the waveforms. YOUNG, younger adult group; YOUNG-D, younger adult depression group; OLD, older adult group; OLD-D, older adult depression group. Dev 80 dB, 80 dB deviant sound; St 60 dB, 60 dB standard sound; Dev 60 dB, 60 dB deviant sound; St 80 dB, 80 dB standard sound.

