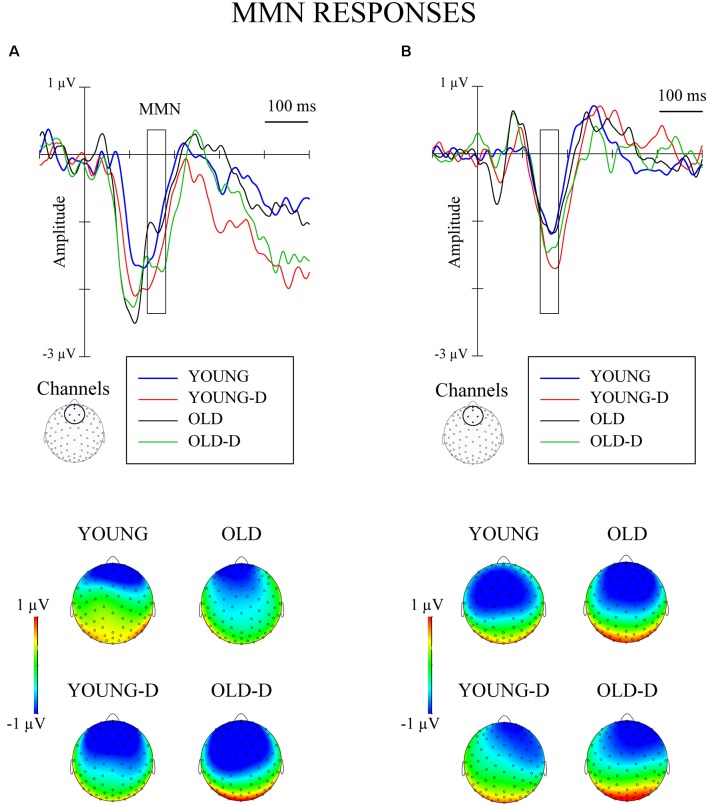
Figure 4.
Grand-averaged waveforms for mismatch negativity (MMN; deviant–standard from the same oddball series) from a frontocentral channel cluster and topographical maps. (A) Increment condition. (B) Decrement condition. The rectangles overlaid with the waveforms and the topographies show the time window applied in the analyses (mean amplitude values between 140 ms and 180 ms after stimulus onset). YOUNG, younger adult group, YOUNG-D, younger adult depression group; OLD, older adult group; OLD-D, older adult depression group.

