
Fig. 3.
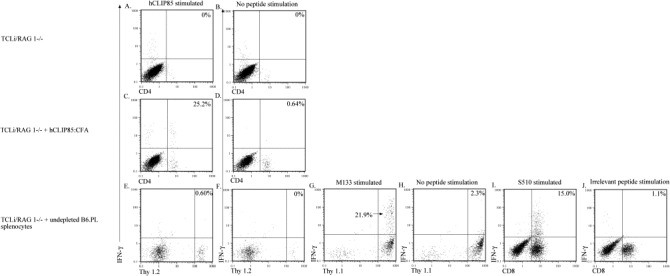
Bystander activation of TCLi CD4 T cells as measured by intracellular cytokine staining was minimal. Lymphocytes were isolated from the brains of mice in each of the experimental groups listed at the left of each row. Cells were stained for intracellular IFN-γ as described in Section 2. The peptide used to stimulate the cells in each panel is indicated at the top of each column. Panels A, C and E show staining of TCLi transgenic T cells after in vitro stimulation with hCLIP85. Panels B, D and F show staining of TCLi cells with no peptide stimulation and serve as controls for panels A, C and E. Panel G shows staining of transferred B6.PL CD4 T cells after stimulation with MHV-specific CD4 T cell peptide M133. Panel H shows staining of B6.PL CD4 T cells with no peptide stimulation and serves a control for G. Panels E–H are gated on CD4+ T cells. Panel I shows staining of B6.PL CD8 T cells after stimulation with MHV-specific CD8 T cell peptide S510. Panel J shows staining of B6.PL CD8 T cells after stimulation with an irrelevant peptide (Ova257) and serves as a control for panel I. Percentages are the percent of CD4 or CD8 T cells that fall in the indicated quadrant.