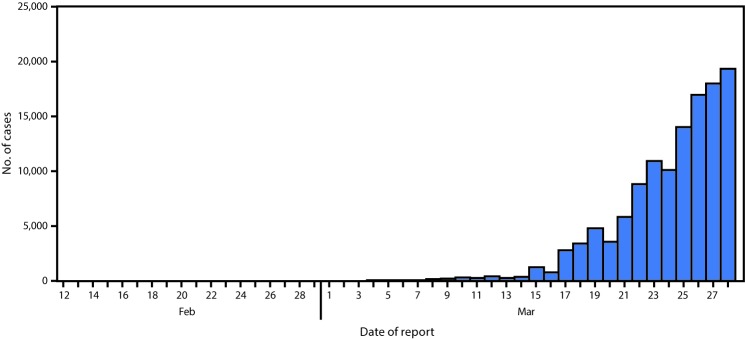
FIGURE.
Daily number of reported COVID-19 cases* — United States, February 12–March 28, 2020†
* Cases among persons repatriated to the United States from Wuhan, China, and the Diamond Princess cruise ship are excluded.
† Cumulative number of COVID-19 cases reported daily by jurisdictions to CDC using aggregate case count was 122,653 through March 28, 2020.

