
Fig. 2.
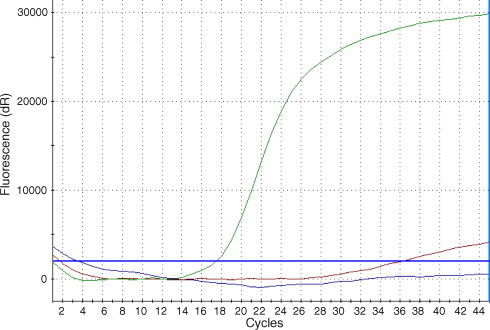
Determination of oseltamivir resistance in influenza A H1N1 isolates using the H275Y RT-PCR assay. Representative amplification curves are shown of both oseltamivir susceptible and resistant clinical isolates. Isolates which were oseltamivir susceptible produced a sigmoidal curve (green) while oseltamivir-resistant isolates produced no curve (blue). Approximately 20% of resistant isolates tested produced a low-fluorescence, non-sigmoidal curve (red).