
Fig. 1.
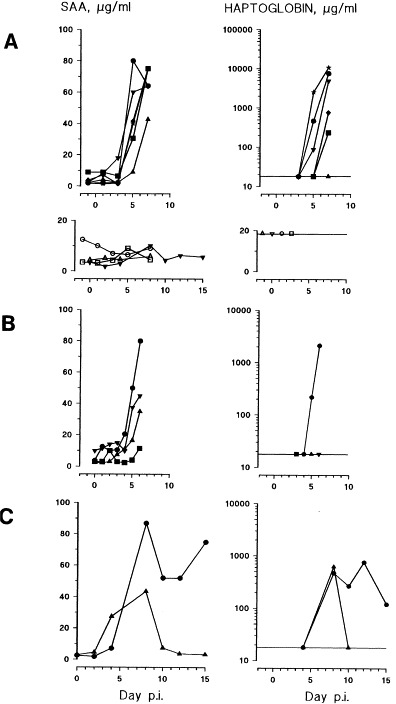
(A) SAA (left-hand side) and haptoglobin (right-hand side). Infected animals: (★) 1; (•) 2; (▾) 3; (◆) 4; (▴) 5; (■) 6. Control animals: (○) 11; (□) 8; (▽) 9; (▵) 10. Horizontal line depicts the detection limit of the assay (haptoglobin). None of the control animals had haptoglobin levels above the detection limit of the assay. (B) SAA (left-hand side) and haptoglobin (right-hand side). Infected animal: (•) 11; (■) 12; (▴) 13; (▾) 14. Horizontal line depicts the detection limit of the assay (haptoglobin). (C) SAA (left-hand side) and haptoglobin (right-hand side). Infected animals: (•) 15; (▴) 16. Horizontal line depicts the detection limit of the assay (haptoglobin).