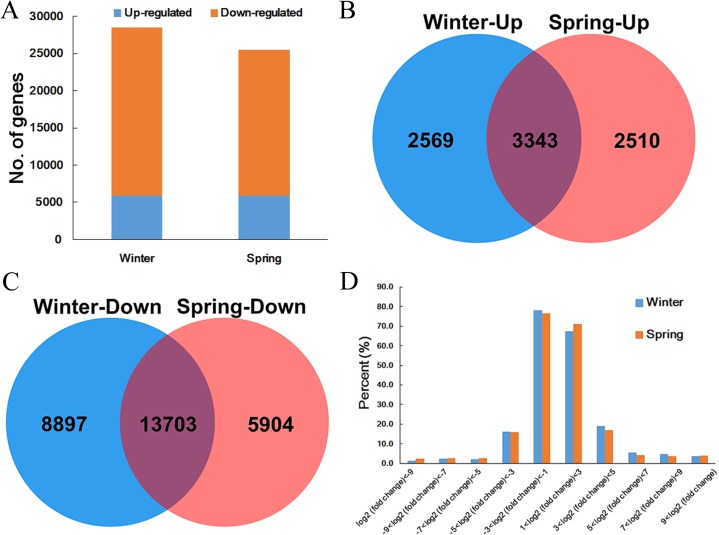
Figure 2. DEGs identified in the two B. napus ecotypes after cold stress.
(A) Statistical analysis of DEGs identified in winter and spring B. napus ecotypes after cold stress. (B) Venn diagram of upregulated gene between spring and winter B. napus ecotypes after cold stress. (C) Venn diagram of downregulated gene between spring and winter B. napus ecotypes after cold stress. (D) Fold change statistics of DEGs identified in spring and winter B. napus ecotypes after cold stress.

