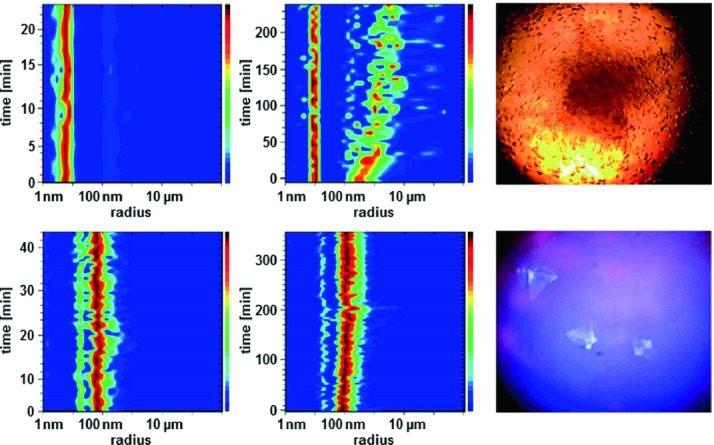
Fig. 6.3.

The half-logarithmic size distribution plots on the left were recorded applying ML-I (top left) and ferritin (bottom left) in solution respectively. The plots in the middle display the respective size-distribution over time after mixing with an appropriate crystallization solution. The abundancy of radii is color-coded from blue (low) to red (high). The pictures obtained from a microscope show crystals grown upon long-term incubation. The displayed ferritin crystals (bottom right), which are >100 µm in all dimensions in size, are exposed to UV-light as well to confirm the intrinsic fluorescence of the protein.
Reproduced from Dierks et al. (2008), Crystal Growth and Design with permission of the American Chemical Society, copyright 2008
