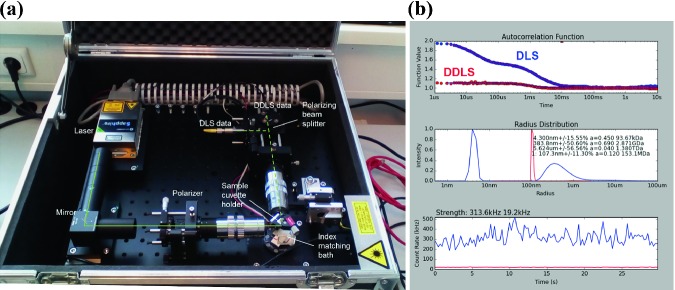
Fig. 6.4.
a Portable DDLS cabinet. The path of the laser beam is indicated by green lines; light scattered by particles inside the cuvette is represented by dashed lines. A CPU is attached for data processing and display. b A single exemplary 20 s measurement to monitor the oligomerization process of the bacterial β-lactamase CTX-M14 (30 kDa) in an early stage of crystallization. The DLS autocorrelation function (blue spheres and lines) indicates a polydisperse sample solution containing a mixture of small oligomers with a radius of approximately 4 nm and larger particles with a radius of a few hundred nm. The intensity of scattered light that is depolarized is quantified by a separate detector (red spheres and lines)

