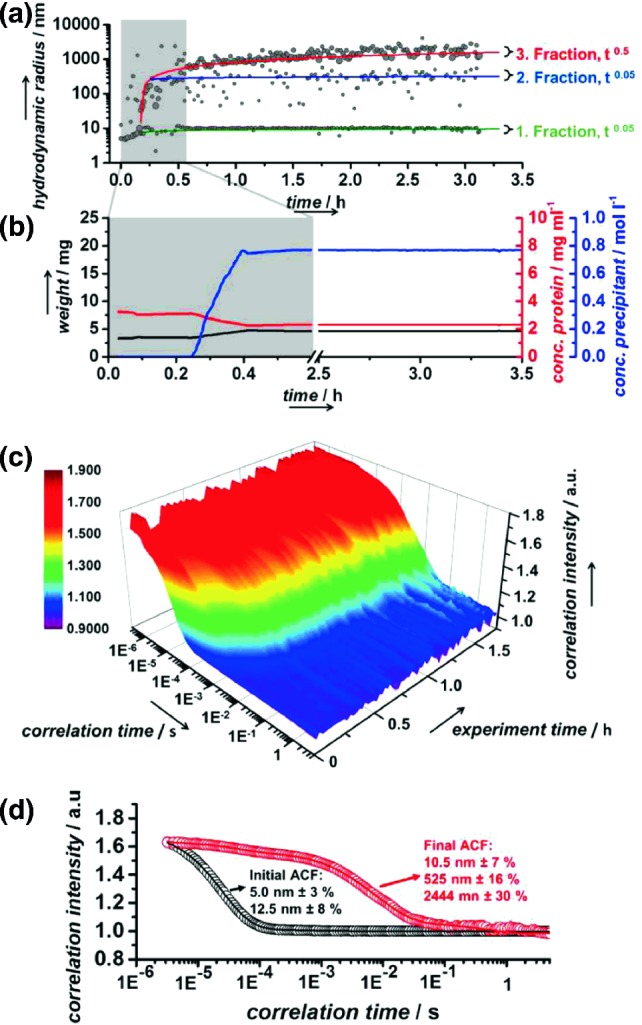
Fig. 6.6.

Induction and characterization of ML-I nucleation utilizing in situ DLS according to Fig. 6.5. a Radius plot of the experiment showing the time course of the hydrodynamic radii. After adding the precipitant solution to supersaturate the protein solution and induce crystal nucleation three distinct radius fractions are detected indicated by the green, blue and red line respectively. b The solution composition and precipitant addition is actively regulated by piezo pumps and monitored over the experiment as displayed. c 3D plot of ACFs indicating increasing polydispersity due to multimodal correlation decay in later stages of the experiment. d Comparison of initial (black) and final (red) ACF visualizing also the particle species composition during a later stage of ML-I crystal growth.
Reproduced from Schubert et al. (2017), Crystal Growth and Design with permission of the American Chemical Society, copyright 2017
