
Fig. 1. A subset of human RGCs is intrinsically photosensitive.
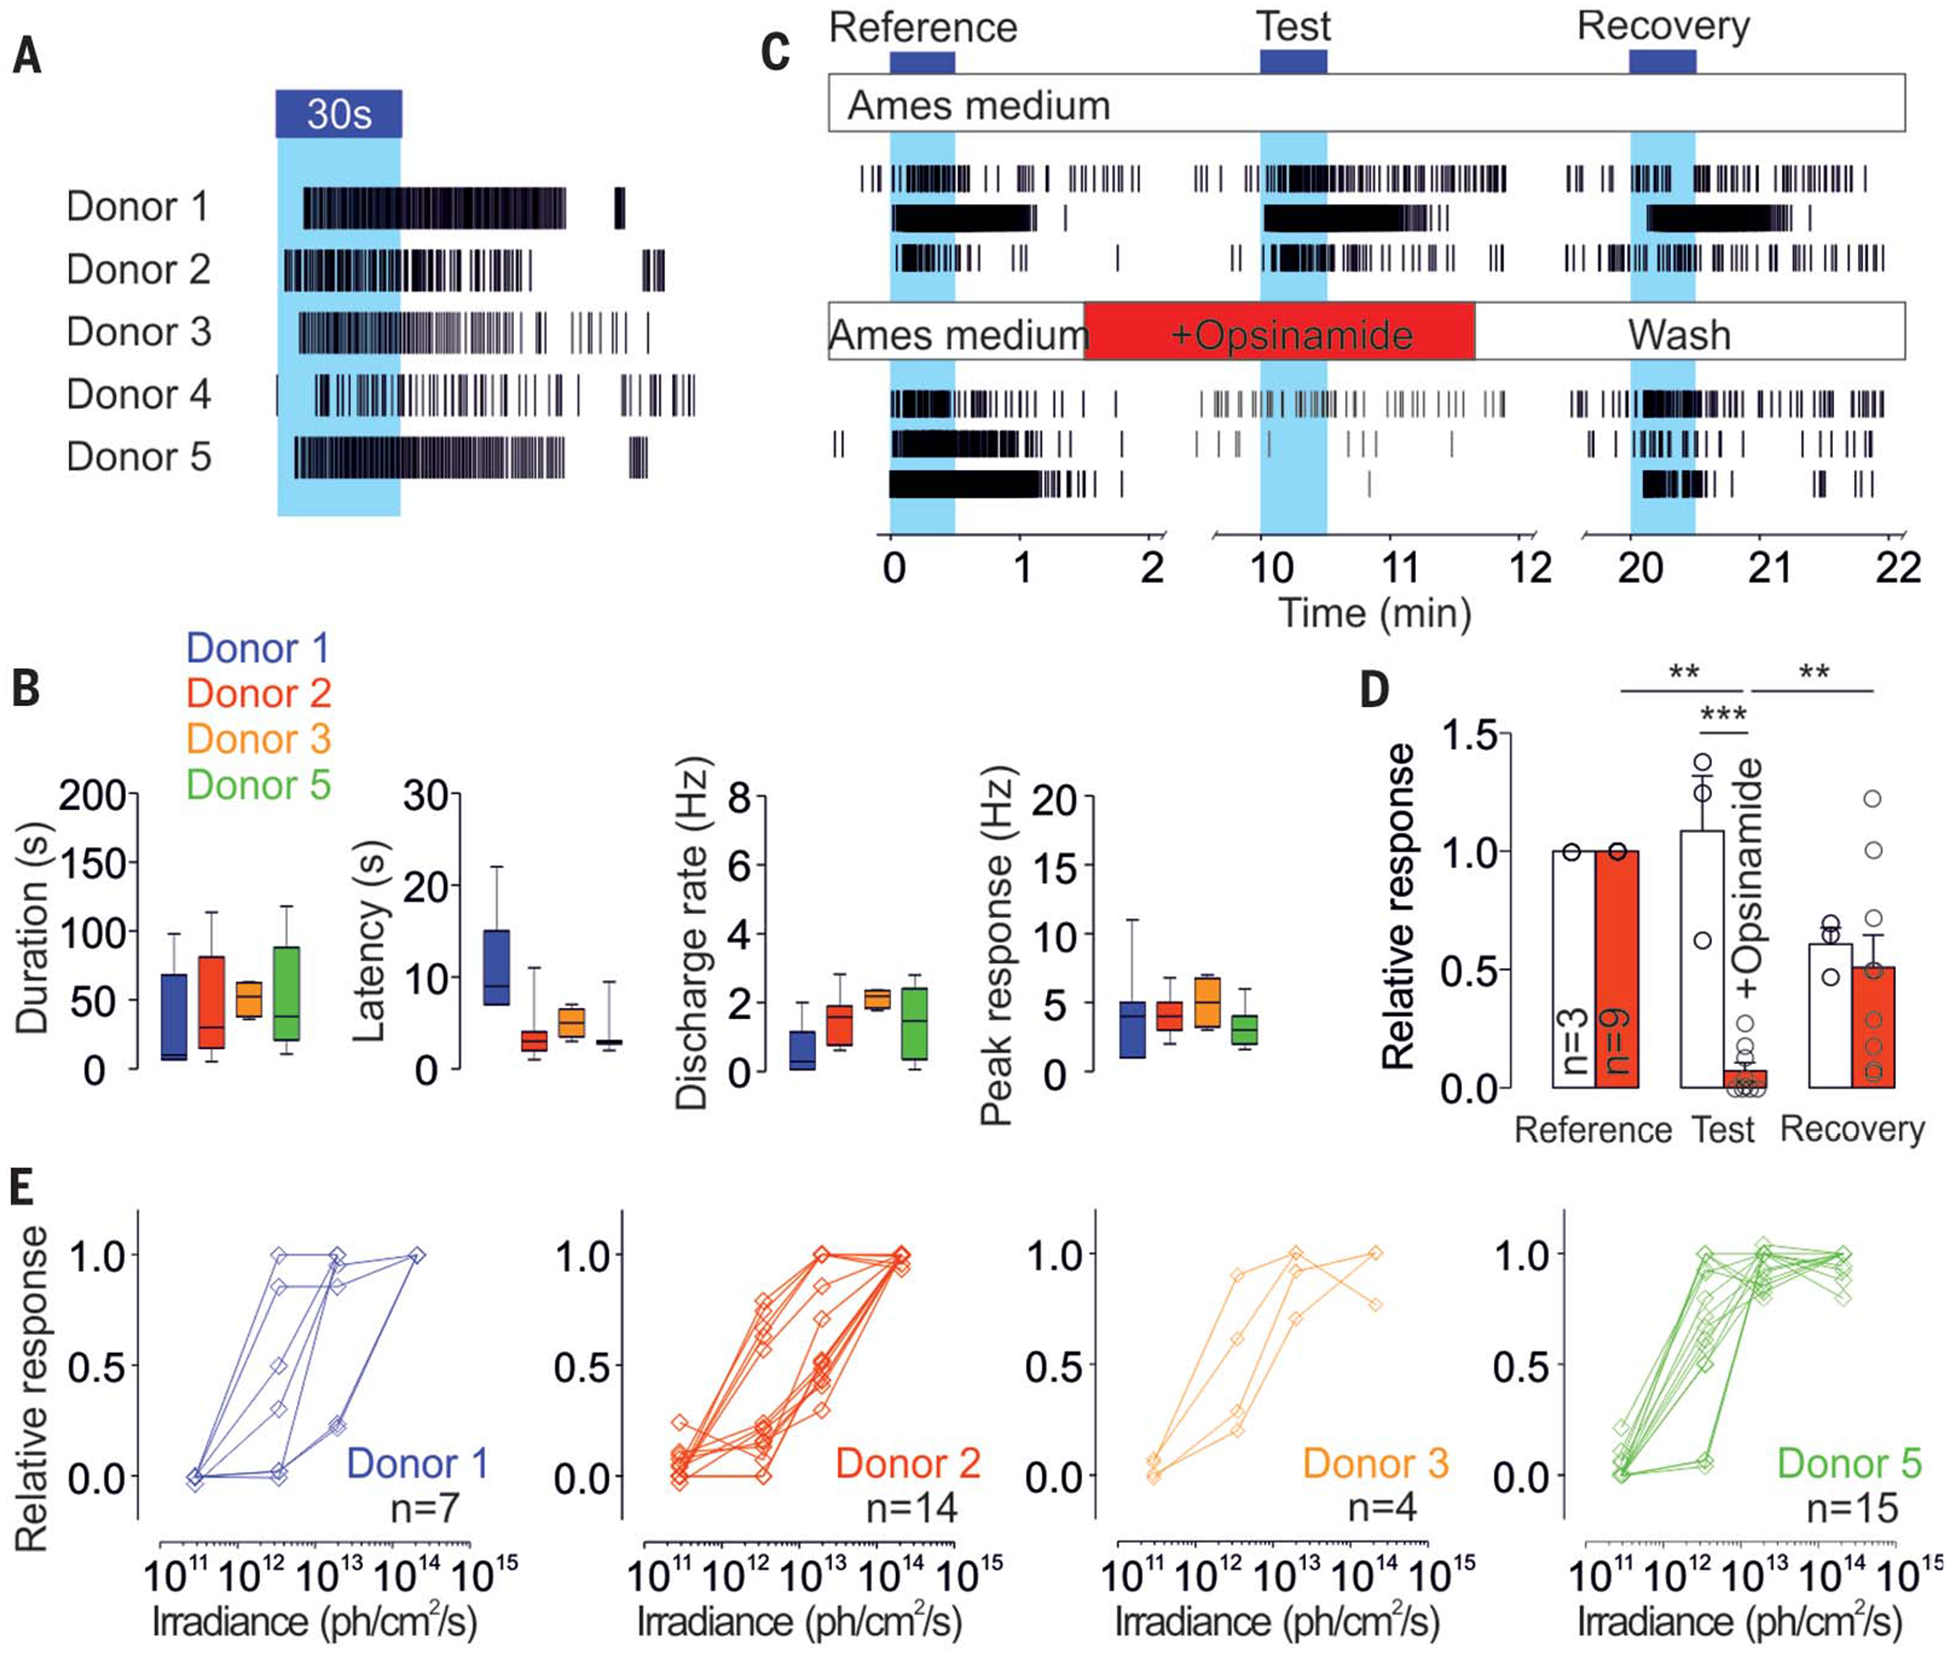
(A) Representative individual ipRGC spike trains to a 30-s light pulse (~1013 photons/cm2 per second, 470 nm) from five different human donors. (B) Average ipRGCs’ response latency, duration, and amplitude in each donor (n = 7, 15, 4, and 15 for donors 1, 2, 3, and 5, respectively, where n is the number of cells). Representative individual ipRGCs spike trains (C) and average responses (D) to three identical 30-s light pulses (~1013 photons/cm2 per second, 470 nm) from a control recording [n = 3; upper panel in (C), white histogram in (D)] or a recording with opsinamide (n = 9; lower panel in (C), red histogram in (D)] during the second stimulation [***P < 0.001, **P < 0.01, ANOVA (analysis of variance), Bonferroni post hoc test, one donor]. (E) Responses of ipRGCs stimulated for 30 s at different irradiances (from 2 × 10¹¹ to 2 × 10¹⁴ photons/cm2per second, 470 nm) in each donor (n = 7, 14, 4, and 15 for donors 1, 2, 3, and 5, respectively). ph, photons. Blue bars and blue background in (A) and (C) indicate light pulses.