
Fig. 2. Human ipRGCs display different subtypes.
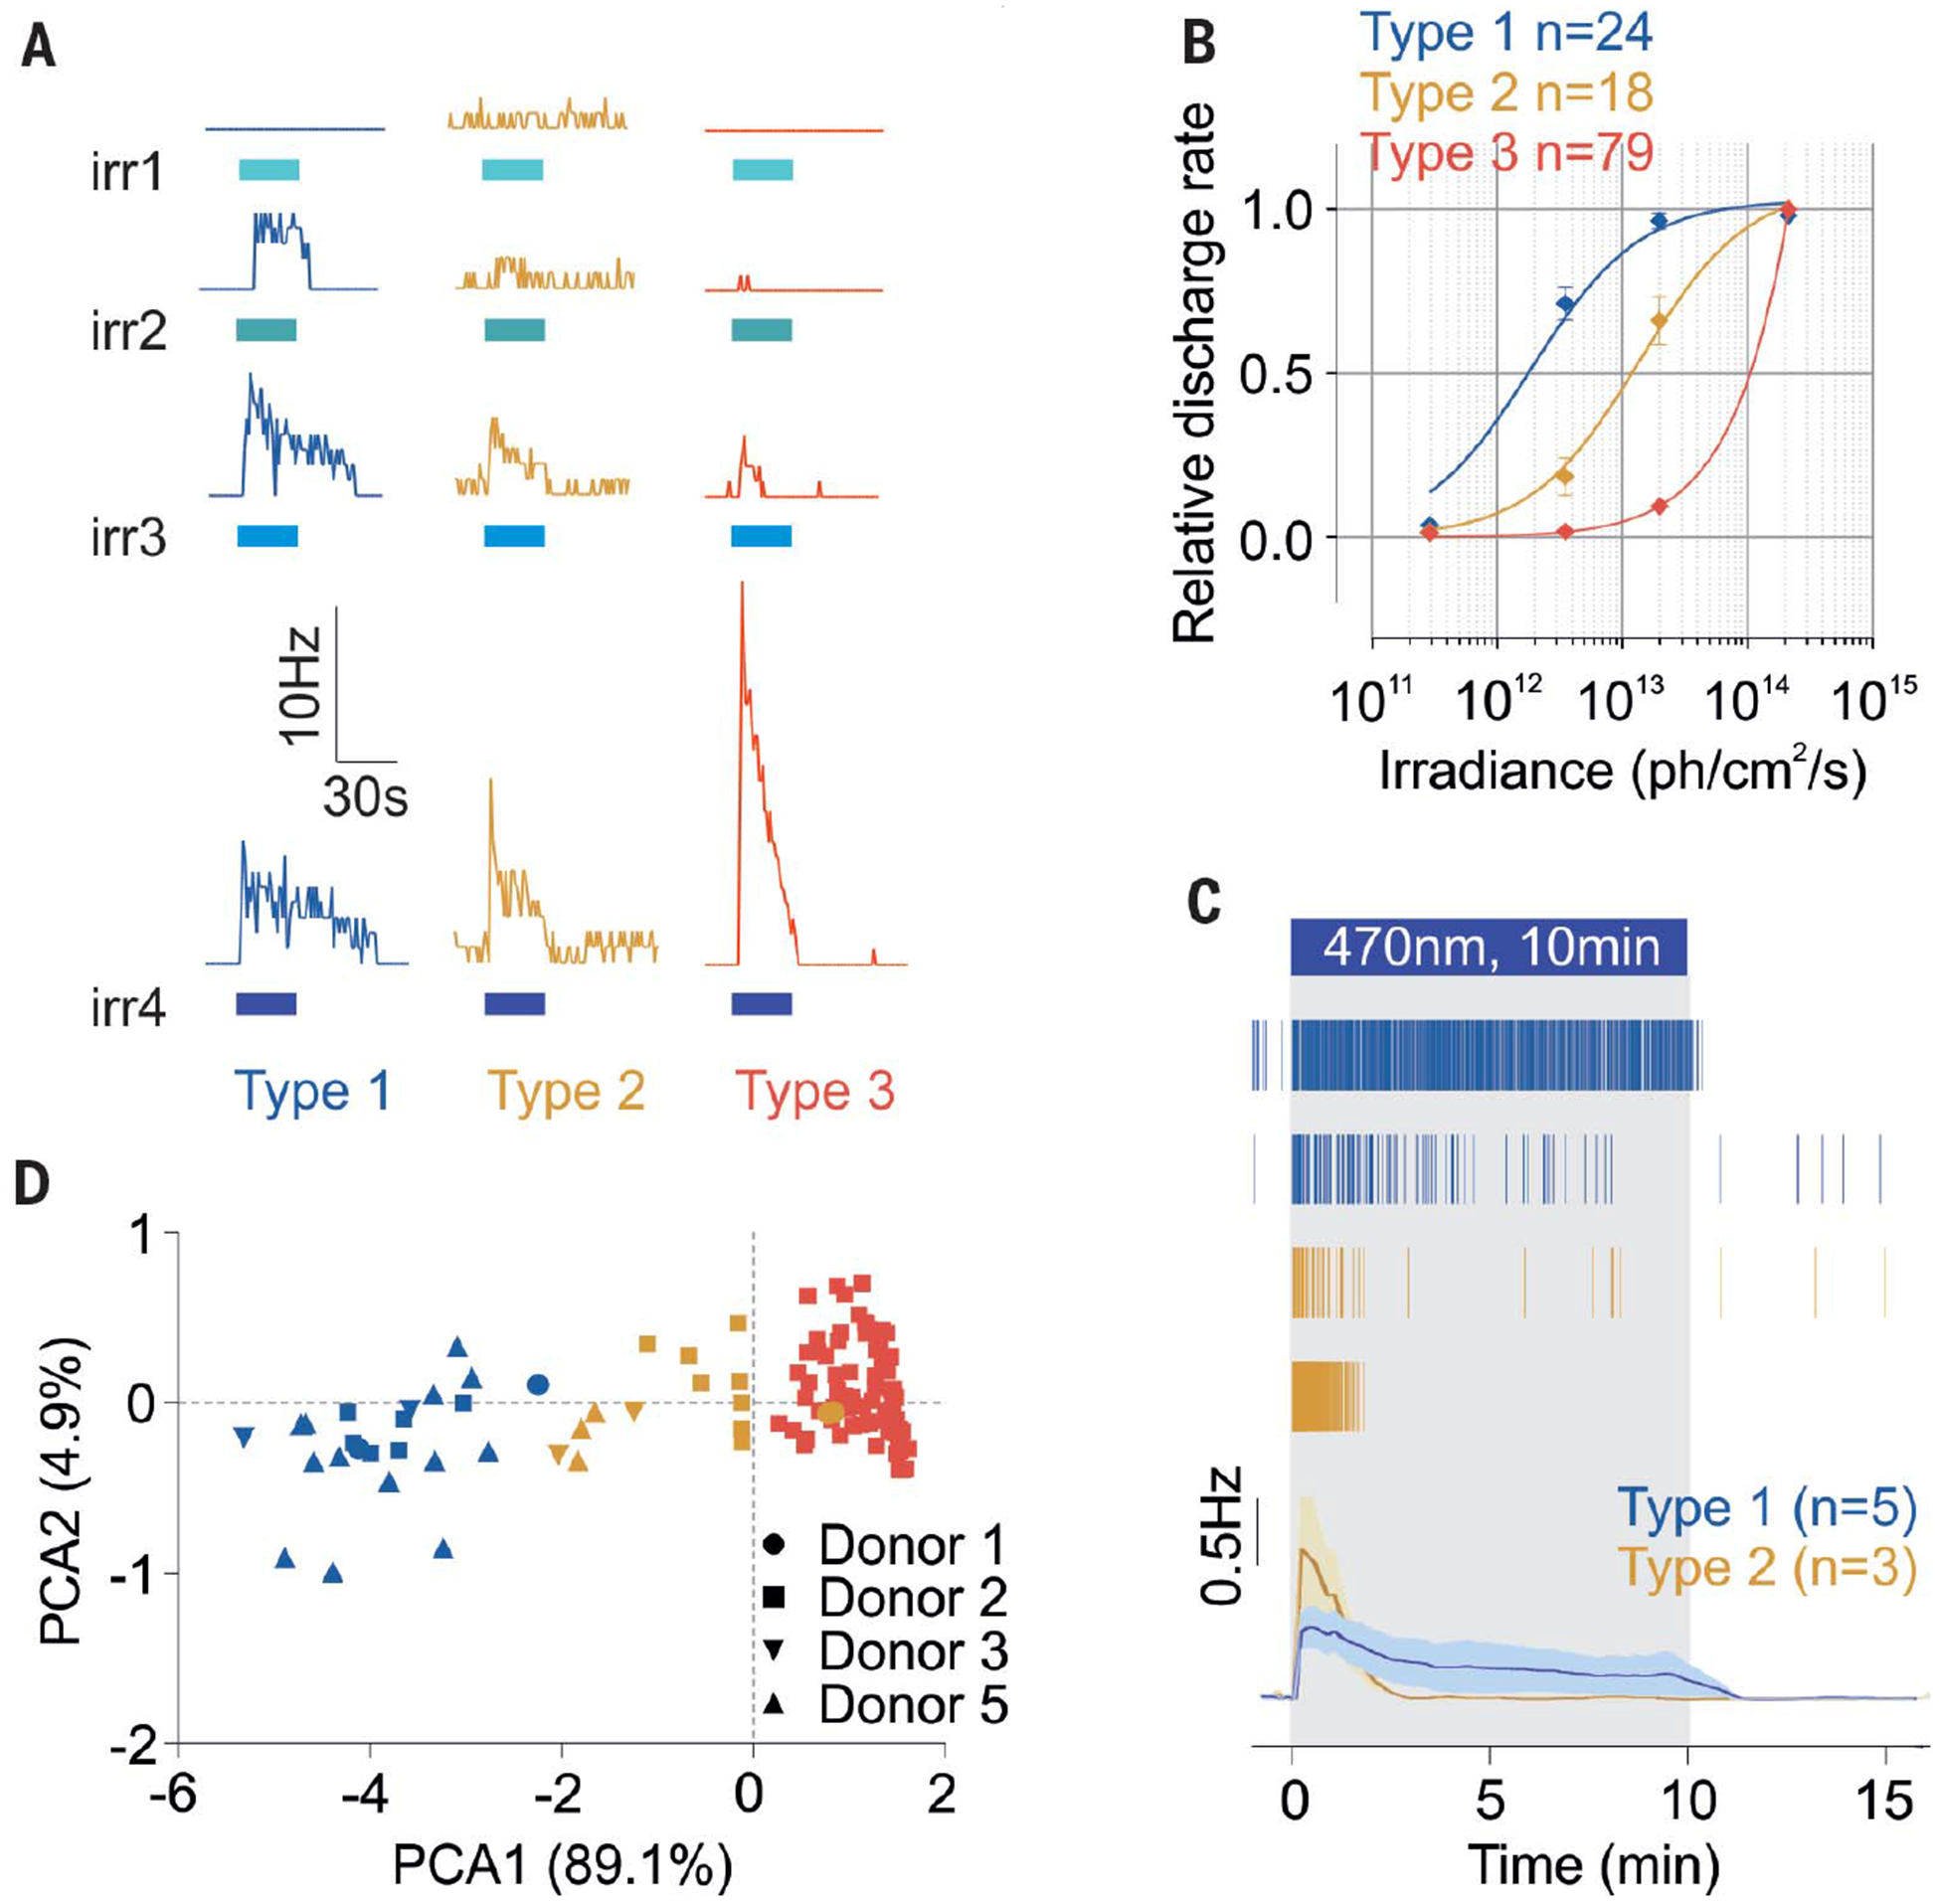
(A) Representative responses from type 1, 2, and 3 ipRGCs to increasing irradiance light pulses [30 s, 470 nm, irradiances (irr) 1, 2, 3, and 4: 2.9 × 10¹¹, 3.5 × 10¹², 2 × 10¹³, and 2 × 10¹⁴ photons/cm2 per second, respectively]. Blue bars indicate light pulses. (B) Corresponding dose–response curves (type 1, n = 24, four donors; type 2, n = 18, four donors; type 3, n = 79, one donor).Error bars indicate SEM. (C) Representative raster plots of type 1 and 2 ipRGCs and average traces in response to 10-min light stimulations (~2 × 10¹³ photons/cm2 per second, 470 nm; type 1, n = 5, and type 2, n = 3). (D) Principal components of the ipRGCs’ response parameters (sensitivity, latency, and duration; n = 121, four donors).