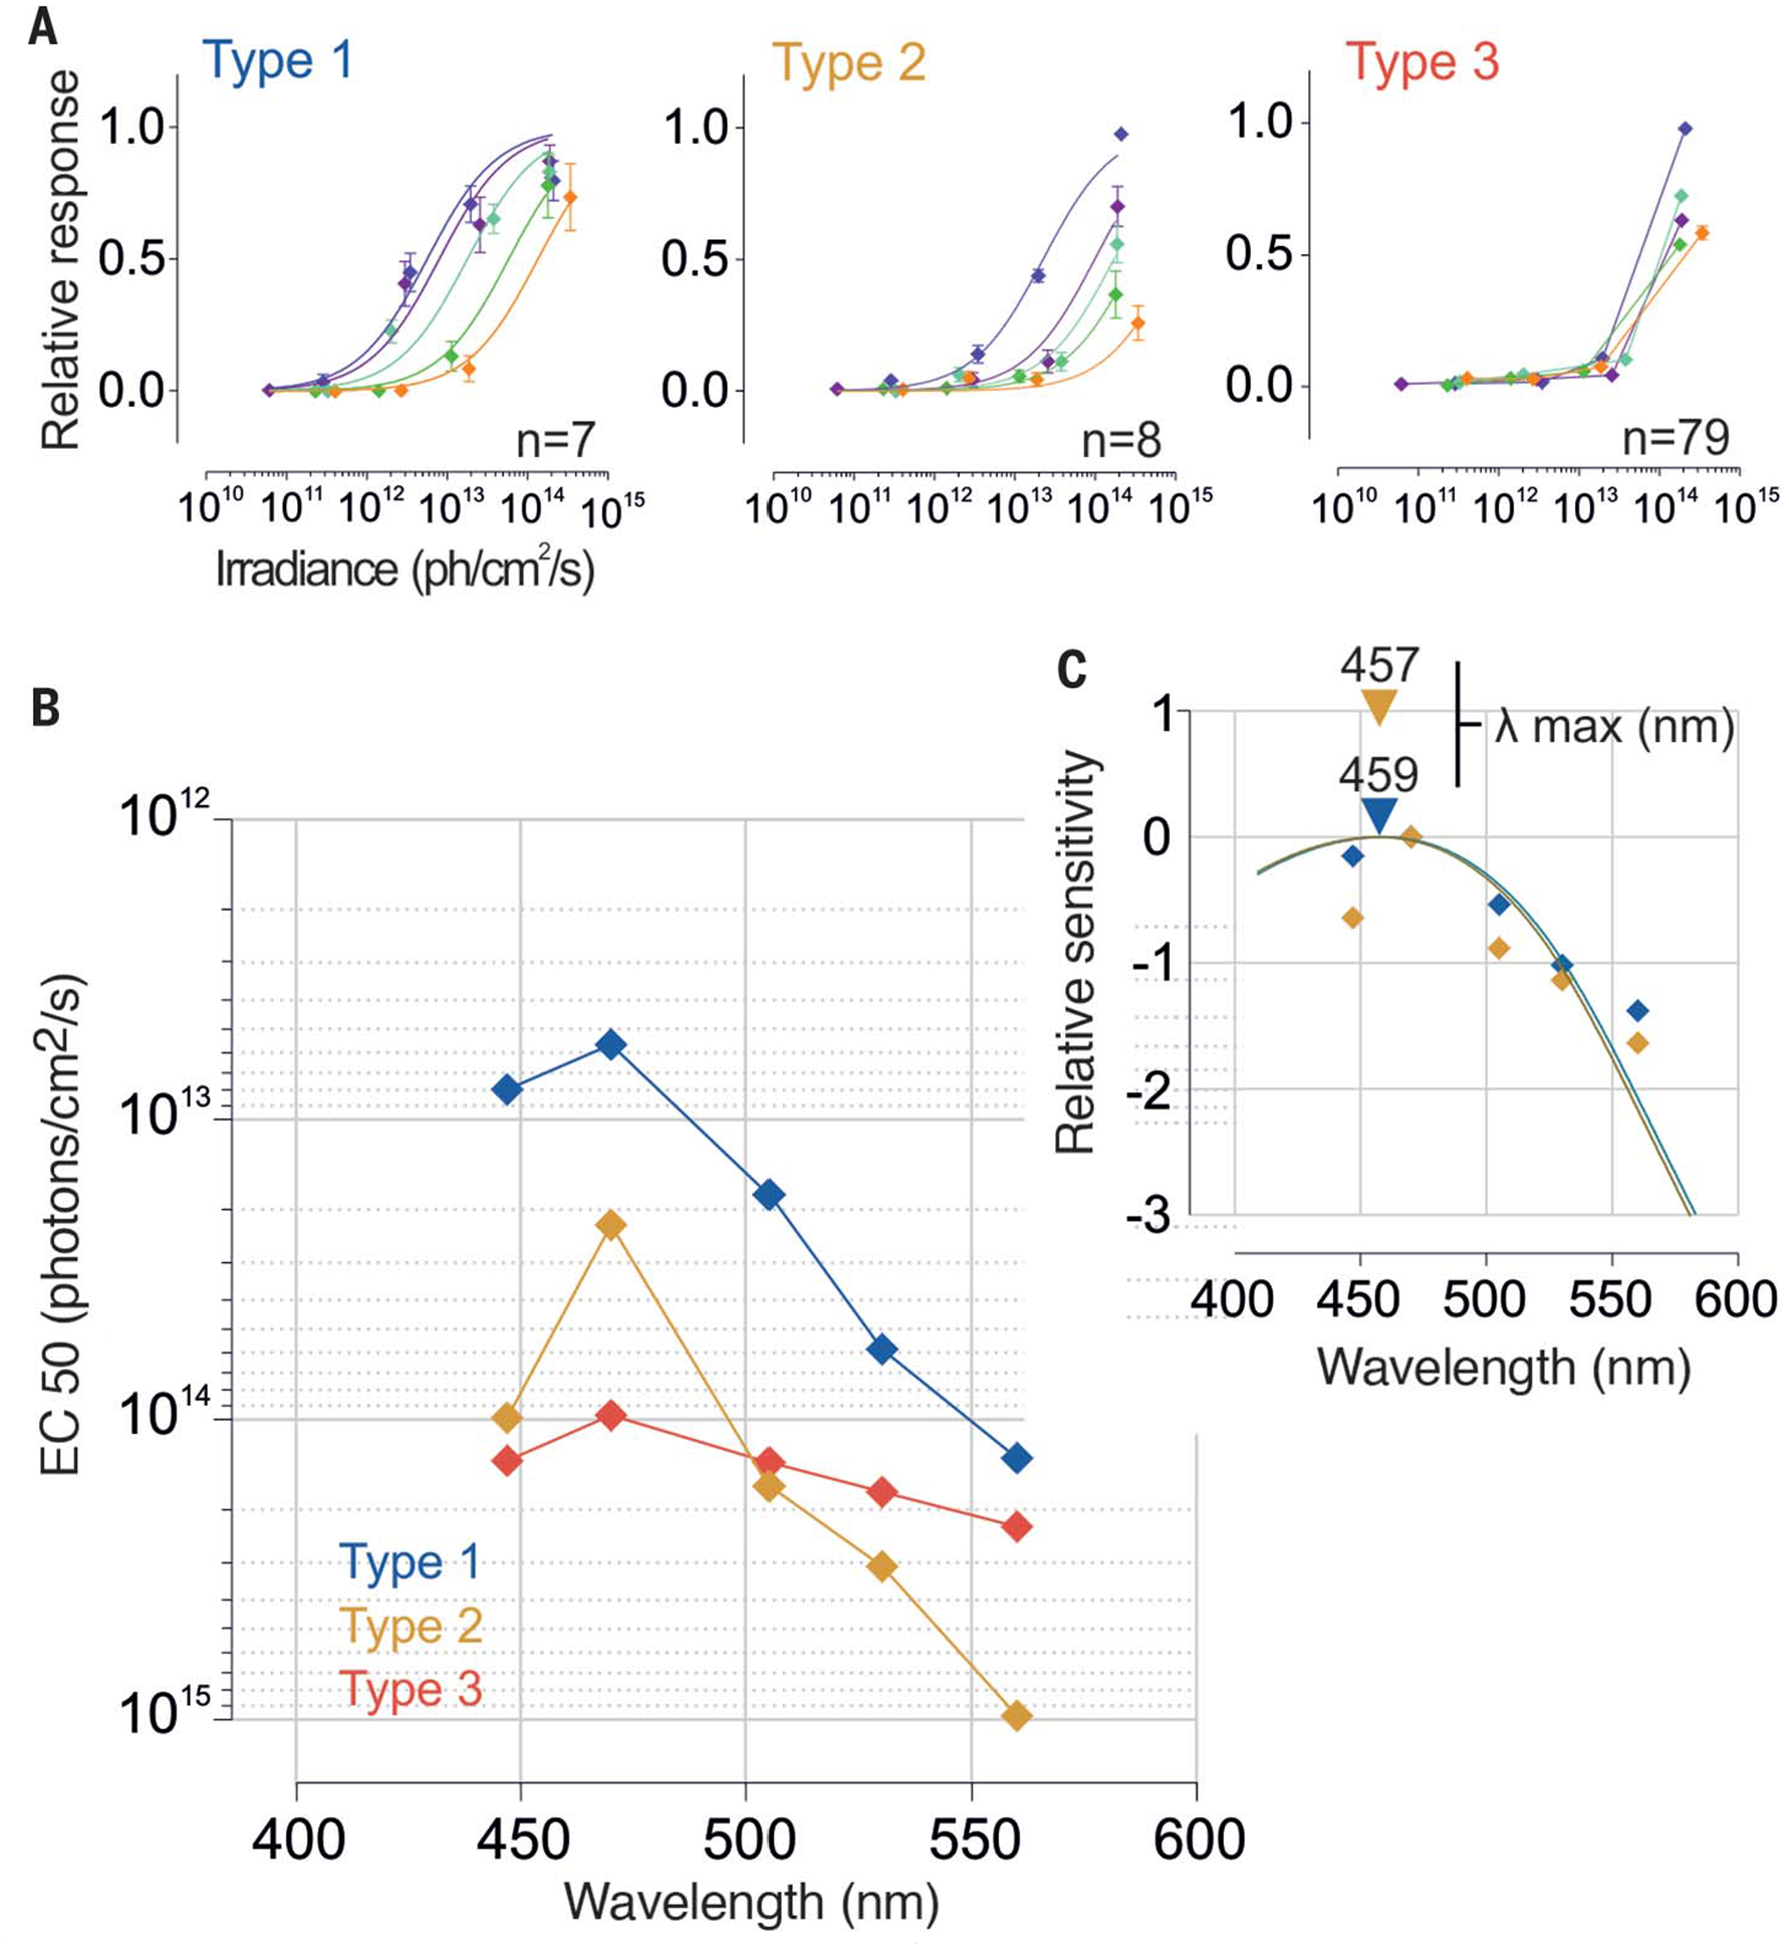
Fig. 3. Spectral sensitivity of human ipRGCs.

(A) Dose–response curves of each subtype to 30-s light pulses at different irradiances and wavelengths (irr1 to irr4, from 5 × 10¹⁰ to 5 × 10¹⁴ photons/cm2 per second; 447, 470, 505, 530, and 560 nm) (type 1, n = 7; type 2, n = 8; type 3, n = 79; one donor). Error bars indicate SEM. (B) Action spectra and (C) best-fitted nomograms for each subtype.EC, irradiance required to drive a 50% response; λ, wavelength.
