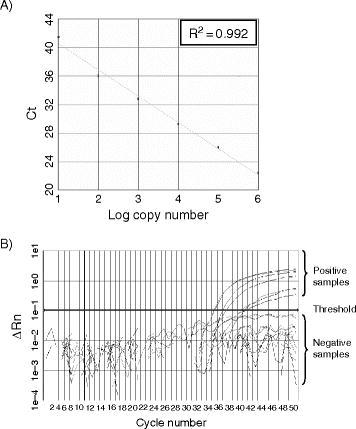
Fig. 1.

Quantitative RT-PCR assay for SARS-CoV: (A) Standard curve for quantitative analysis of ORF 1b of SARS-CoV. The threshold cycle (Ct) is the number of PCR cycles required for the fluorescent intensity of the reaction to reach a predefined threshold. The Ct is inversely proportional to the logarithm of the starting concentration of the input target. The correlation coefficient (R2) between these two parameters is shown. (B) An amplification plot of fluorescence intensity against the PCR cycle. The fluorescence signals for positive and negative samples are indicated. The X-axis denotes the cycle number of a quantitative PCR assay. The Y-axis denotes the fluorescence intensity.
